. 2025 Apr 1;16(4):425.
doi: 10.3390/genes16040425.

GONNMDA: A Ordered Message Passing GNN Approach for miRNA-Disease Association Prediction

Affiliations

GONNMDA: A Ordered Message Passing GNN Approach for miRNA-Disease Association Prediction

Sihao Zeng et al. Genes (Basel). .

Abstract

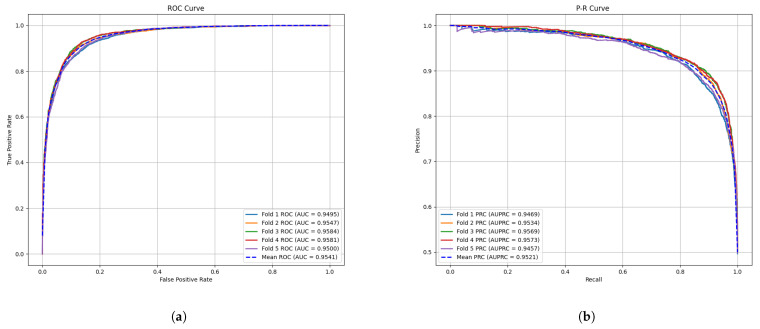
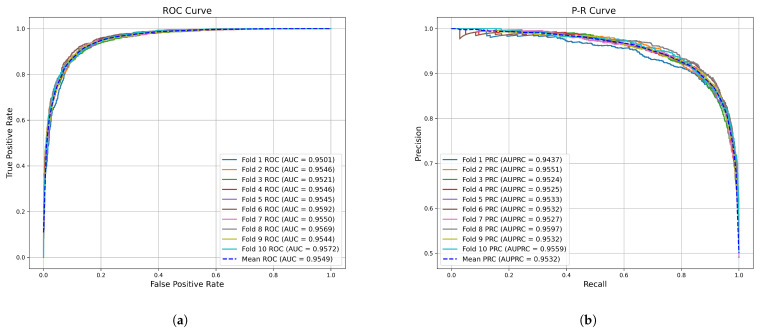
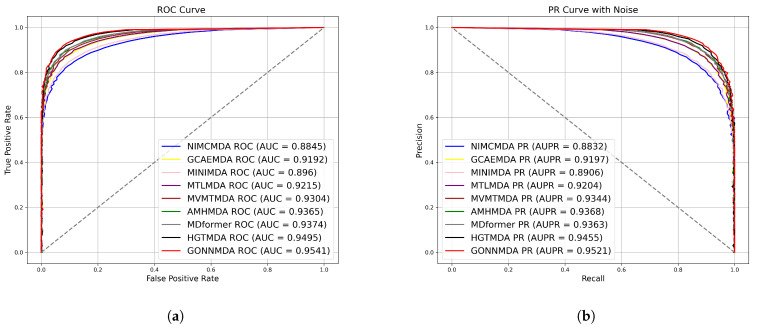
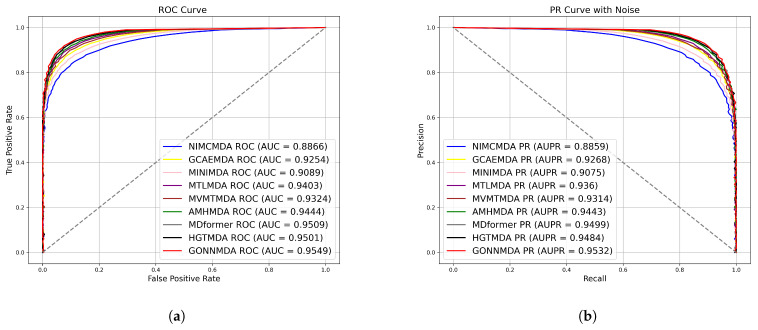
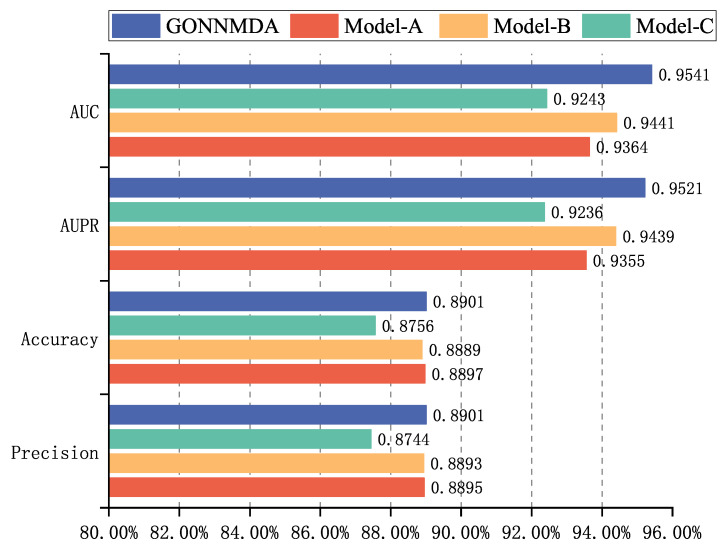
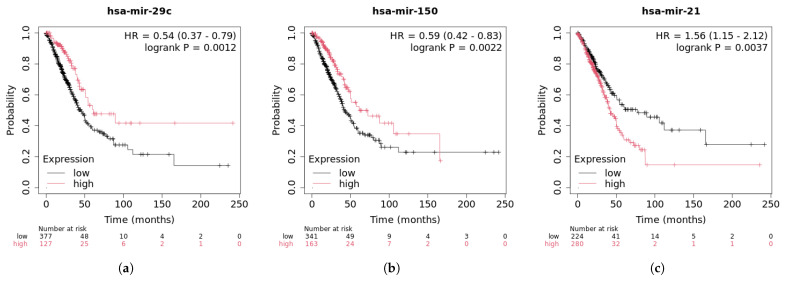
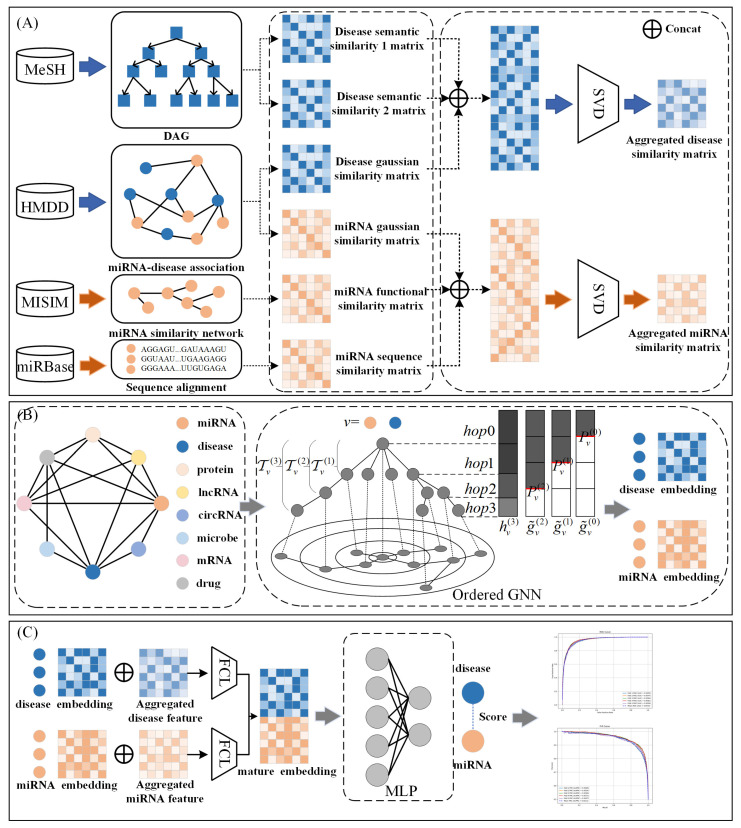
Small non-coding molecules known as microRNAs (miRNAs) play a critical role in disease diagnosis, treatment, and prognosis evaluation. Traditional wet-lab methods for validating miRNA-disease associations are often time-consuming and inefficient. With the advancement of high-throughput sequencing technologies, deep learning methods have become effective tools for uncovering potential patterns in miRNA-disease associations and revealing novel biological insights. Most of the existing approaches focus primarily on individual molecular behavior, overlooking interactions at the multi-molecular level. Conventional graph neural network (GNN) models struggle to generalize to heterogeneous graphs, and as network depth increases, node representations become indistinguishable due to over-smoothing, resulting in reduced predictive performance. GONNMDA first integrates similarity features from multiple data sources and applies noise reduction to obtain a reconstructed, comprehensive similarity representation. It then constructs heterogeneous graphs and applies a root-tree hierarchical alignment, along with an ordered gating message-passing mechanism, effectively addressing the challenges of heterogeneity and over-smoothing. Finally, a multilayer perceptron is employed to produce the final association predictions. To evaluate the effectiveness of GONNMDA, we conducted extensive experiments where the model achieved an AUC of 95.49% and an AUPR of 95.32%. The results demonstrate that GONNMDA outperforms several recent state-of-the-art methods. In addition, case studies and survival analyses on three common human cancers-breast cancer, rectal cancer, and lung cancer-further validate the effectiveness and reliability of GONNMDA in predicting miRNA-disease associations.

Keywords: heterogeneous graph; miRNA–disease association; ordered GNN; singular value decomposition.


Conflict of interest statement

The authors declare no conflicts of interest.

Figures

Figure 1
Figure 1
The performance of GONNMDA on 5-fold cross-validation. (a) ROC curves; (b) P-R curves.
Figure 2
Figure 2
The performance of GONNMDA on 10-fold cross-validation. (a) ROC curves; (b) P-R curves.
Figure 3
Figure 3
Comparison with the state-of-the-art method on 5-fold cross-validation (a) ROC curves; (b) P-R curves.
Figure 4
Figure 4
Comparison with the state-of-the-art method on 10-fold cross-validation (a) ROC curves; (b) P-R curves.
Figure 5
Figure 5
Ablation experiments with different models of GONNMDA.
Figure 6
Figure 6
Parameter analysis for hidden layer size.
Figure 7
Figure 7
Parameter analysis for ordered GNN layers (a) The values of AUC and AUPR under different layers; (b) The values of ACC and F1 and recall and precision under different layers.
Figure 8
Figure 8
Parameter analysis for chunk size.
Figure 9
Figure 9
Visualization of miRNA and disease nodes embedded in different ordered GNN layers. (a) Layer 1; (b) Layer 2; (c) Layer 3; (d) Layer 4; (e) Layer 5.
Figure 9
Figure 9
Visualization of miRNA and disease nodes embedded in different ordered GNN layers. (a) Layer 1; (b) Layer 2; (c) Layer 3; (d) Layer 4; (e) Layer 5.
Figure 10
Figure 10
Survival analysis of top 3 predictive miRNA in breast cancer.(a) hsa-mir-21 survival curve; (b) hsa-mir-146a survival curve; (c) hsa-mir-29a survival curve.
Figure 11
Figure 11
Survival analysis of top 3 predictive miRNA in rectal cancer.(a) hsa-mir-15a survival curve; (b) hsa-mir-24 survival curve; (c) hsa-mir-223 survival curve.
Figure 12
Figure 12
Survival analysis of top 3 predictive miRNA in lung cancer.(a) hsa-mir-29c survival curve; (b) hsa-mir-150 survival curve; (c) hsa-mir-21 survival curve.
Figure 13
Figure 13
The framework of GONNMDA.(A) Reconstructed similarity feature; (B) Ordered GNN; (C) Multilayer perceptron.

Similar articles

References

    1. Mattie M.D., Benz C.C., Bowers J., Sensinger K., Wong L., Scott G.K., Fedele V., Ginzinger D., Getts R., Haqq C. Optimized high throughput microRNA expression profiling provides novel biomarker assessment of clinical prostate and breast cancer biopsies. Mol. Cancer. 2006;5:24. - PMC - PubMed
    1. Chen P.-S., Su J.-L., Cha S.-T., Tarn W.-Y., Wang M.-Y., Hsu H.-C., Lin M.-T., Chu C.-Y., Hua K.-T., Chen C.-N. Erratum: MiR-107 promotes tumor progression by targeting the let-7 microRNA in mice and humans. J. Clin. Investig. 2011;121:3442–3455. - PMC - PubMed
    1. Liu Y., Li P., Liu L., Zhang Y. The diagnostic role of miR-122 in drug-induced liver injury: A systematic review and meta-analysis. Medicine. 2018;97:e13478. - PMC - PubMed
    1. Raponi M., Dossey L., Jatkoe T., Wu X., Chen G., Fan H., Beer D.G. MicroRNA classifiers for predicting prognosis of squamous cell lung cancer. Cancer Res. 2009;69:5776–5783. - PubMed
    1. Calabrese F., Lunardi F., Pezzuto F., Fortarezza F., Vuljan S.E., Marquette C., Hofman P. Are there new biomarkers in tissue and liquid biopsies for the early detection of non-small cell lung cancer? J. Clin. Med. 2019;8:414. doi: 10.3390/jcm8030414. - DOI - PMC - PubMed

MeSH terms

LinkOut - more resources