. 2025 Apr 15;16(4):452.
doi: 10.3390/genes16040452.

Deciphering Gut Microbiome in Colorectal Cancer via Robust Learning Methods

Affiliations

Deciphering Gut Microbiome in Colorectal Cancer via Robust Learning Methods

Huiye Han et al. Genes (Basel). .

Abstract

Background: Colorectal cancer (CRC) is one of the most prevalent cancers worldwide and is closely linked to the gut microbiota. Identifying reproducible and generalizable microbial signatures holds significant potential for enhancing early detection and advancing treatment for this deadly disease.

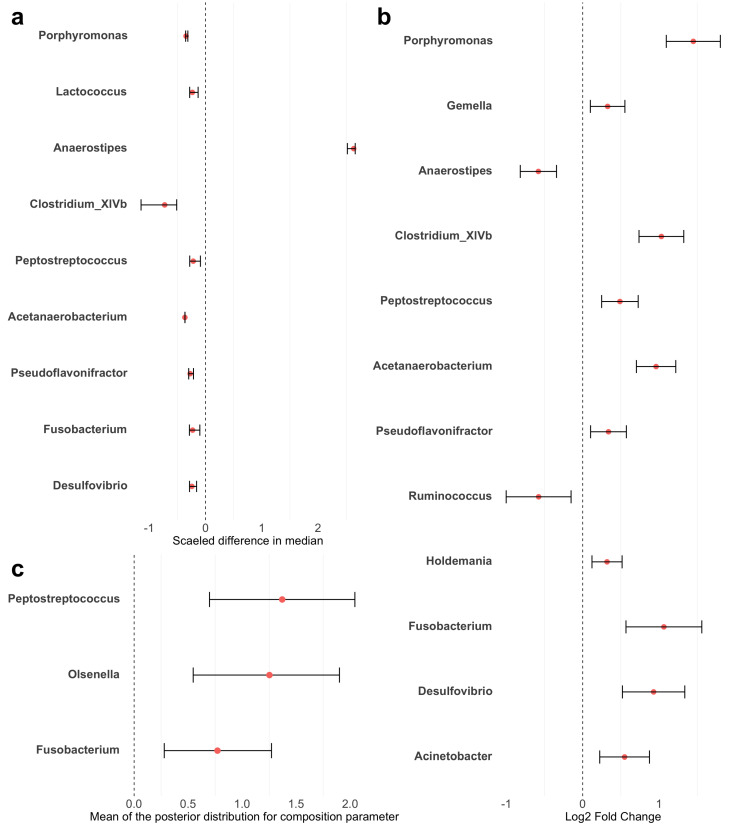
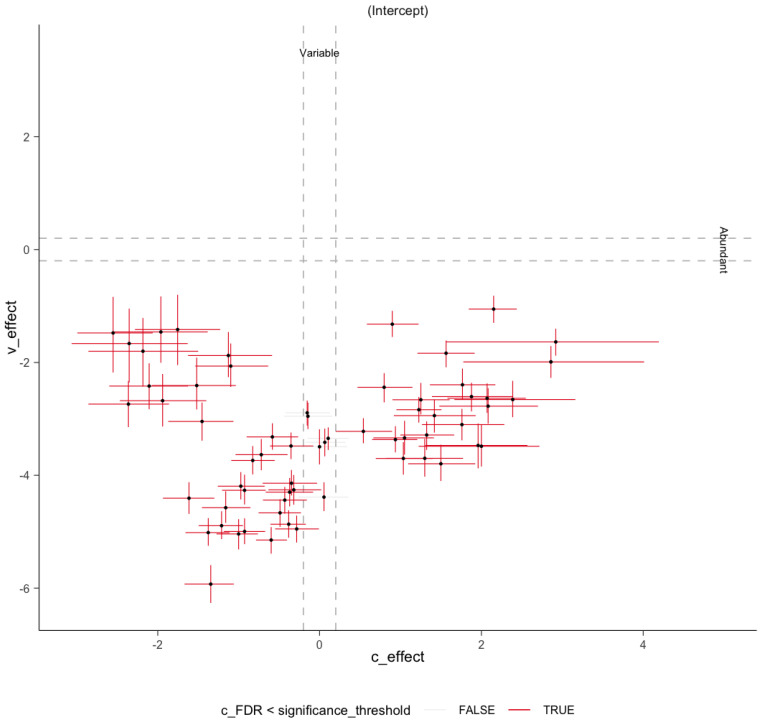
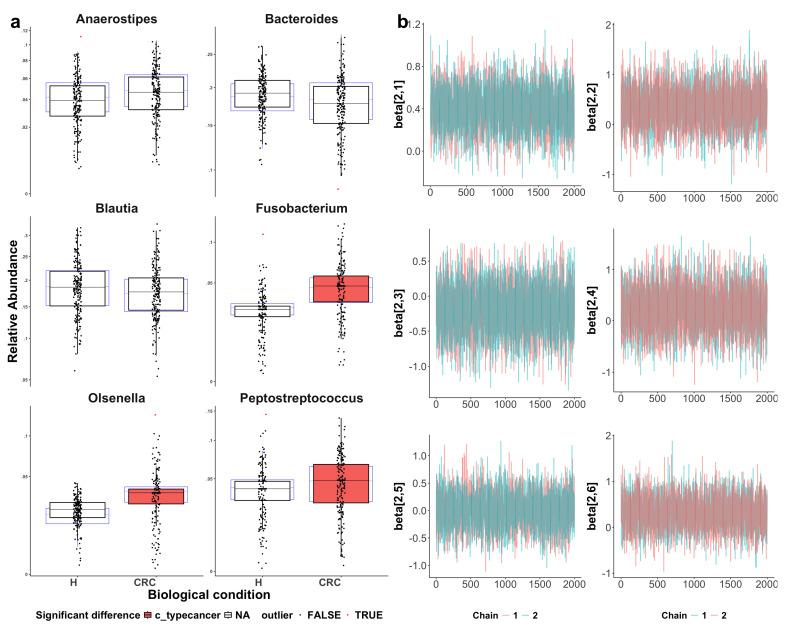
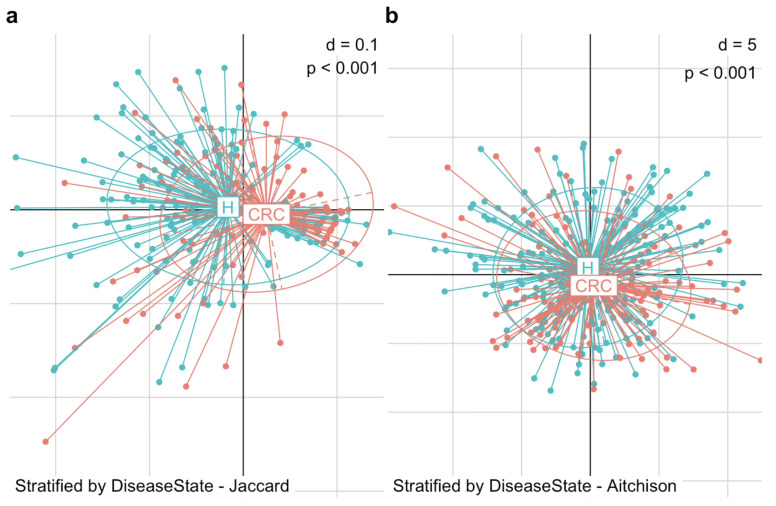
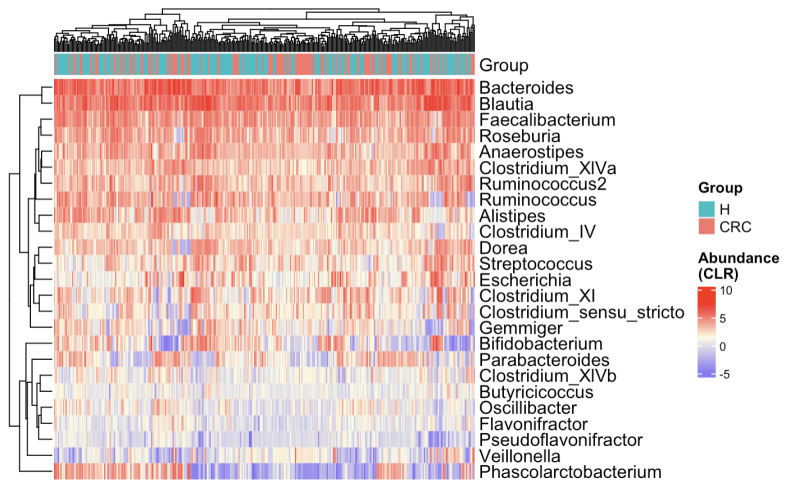
Methods: This study integrated various publicly available case-control datasets to identify microbial signatures for CRC. Alpha and beta diversity metrics were evaluated to characterize differences in gut microbial richness, evenness, and overall composition between CRC patients and healthy controls. Differential abundance analysis was conducted using ANCOM-BC and LEfSe to pinpoint individual taxa that were enriched or depleted in CRC patients. Additionally, sccomp, a Bayesian machine learning method from single-cell analysis, was adapted to provide a more robust validation of compositional differences in individual microbial markers.

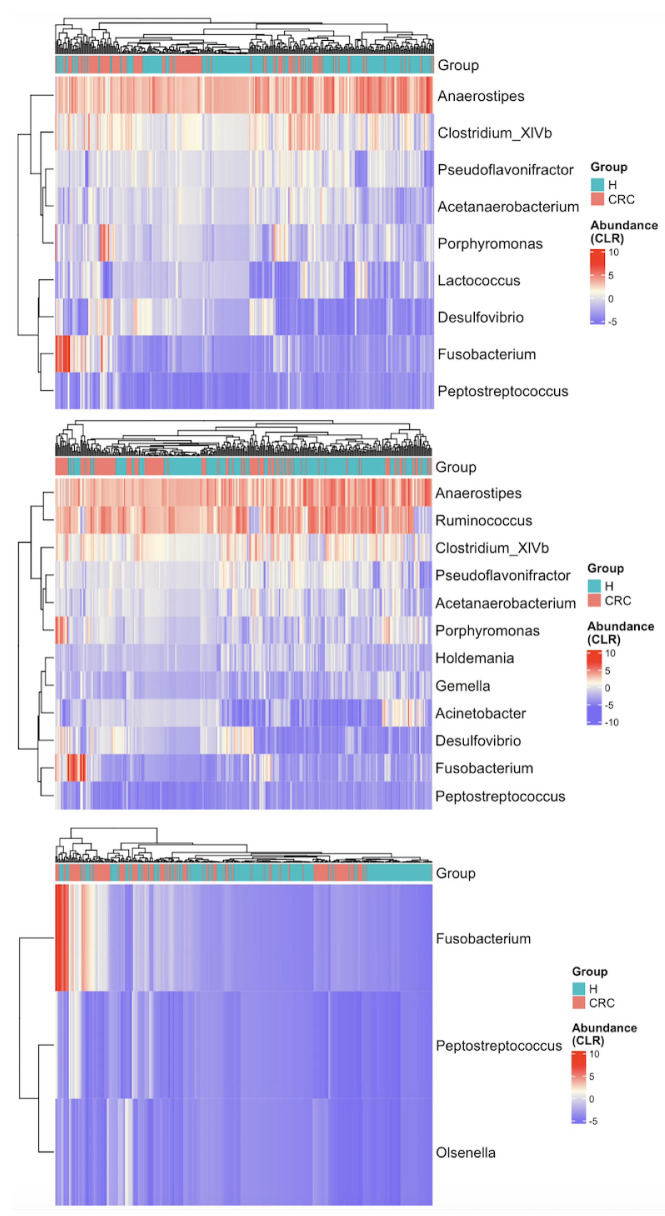
Results: Gut microbial richness is significantly higher in CRC patients, and overall microbiome composition differs significantly between CRC patients and healthy controls. Several taxa, such as Fusobacterium and Peptostreptococcus, are enriched in CRC patients, while others, including Anaerostipes, are depleted. The microbial signatures identified from the integrated data are reproducible and generalizable, with many aligning with findings from previous studies. Furthermore, the use of sccomp enhanced the precision of individual microbial marker identification.

Conclusions: Biologically, the microbial signatures identified from the integrated data improve our understanding of the gut microbiota's role in CRC pathogenesis and may contribute to the development of translational targets and microbiota-based therapies. Methodologically, this study demonstrates the effectiveness of adapting robust techniques from single-cell research to improve the precision of microbial marker discovery.

Keywords: colorectal cancer; data integration; gut microbiota; microbial signatures; robust differential composition analysis.


Conflict of interest statement

The authors declare no conflicts of interest.

Figures

Figure A1
Figure A1
Comparison of the top 25 most common taxa’s relative abundances between colorectal cancer patients (CRC) and healthy controls (H). Each panel presents one taxon, with boxplots illustrating the distributions of its relative abundance in the CRC and healthy groups and the y-axis representing log-transformed relative abundance (we added 0.5 to all counts before taking log of relative abundances to avoid log of zeros). The visual exploration highlights the differential abundances of several taxa, such as Anaerostipes, Clostridium_XIVb, and Pseudoflavonifractor, between the CRC and healthy groups.
Figure A2
Figure A2
Forest plots of differential taxa abundance between colorectal cancer patients and healthy controls. Red points represent the estimated differences in abundance. Error bars represent the 95% confidence intervals. (a) LEfSe: estimates were scaled to standardize the median differences obtained from the Wilcoxon rank sum test. (b) ANCOM-BC: estimates are log fold changes. (c) sccomp: estimates are the mean of posterior distribution for the composition parameter. LowerCI and UpperCI are the 2.5% and 97.5% quantiles of the posterior distribution for the composition parameter.
Figure A3
Figure A3
Variability to abundance relationship examined by sccomp. A two-dimensional plot of estimates of composition effect (c_effect) on the x-axis and variability effect (v_effect) on the y-axis. It shows a positive linear relationship between mean abundance (inverse softmax) and mean variability (log), with bimodality for a group of taxa. Error bars are the 95% credible interval. Red error bars represent significant associations. Gray dashed lines represent the minimum effect size for significance (0.2 fold-change).
Figure A4
Figure A4
Visualization of sccomp model fit. CRC indicates colorectal cancer patients and H indicates healthy controls. (a) Boxplots assessing model adequacy. Blue boxplots represent the predicted data from estimated posterior distributions, while black boxplots indicate the observed data, with outliers highlighted as red triangles. The alignment between the predicted and observed data suggests a good model fit. The three identified differentially abundant taxa (with the CRC group highlighted in red) show more noticeable differences between the CRC and healthy groups as compared to the three reference taxa. (b) Visualization of Markov chain Monte Carlo (MCMC) chains from the posterior distribution, used to evaluate parameter convergence and distribution characteristics. The convergence of parameter estimation for Anaerostipes, Bacteroides, Blautia, Fusobacterium, Olsenella, and Peptostreptococcus (from top-left to bottom-right) supports the reliability of the inference.
Figure A5
Figure A5
Heatmaps of CLR-transformed abundances of the differentially abundant taxa identified by LEfSe (top), ANCOM-BC (middle), and sccomp (bottom). Each row (y-axis) represents a taxon, and each column (x-axis) corresponds to a subject. CRC indicates colorectal cancer patients and H indicates healthy controls. The color intensity represents the CLR-transformed abundance of each taxon. Hierarchical clustering of the subjects based on the reduced gut microbial profiles enhances the separation between CRC patients and healthy controls as compared to Figure 3.
Figure 1
Figure 1
Differences in alpha diversity between colorectal cancer patients (CRC) and healthy controls (H). Violin plots with individual data points display the alpha diversity distribution in each group. (a) Richness in CRC patients is significantly higher than that in healthy controls (p < 0.001 by the Wilcoxon rank sum test). (b) Shannon index accounting for both richness and evenness is not significantly different between CRC patients and healthy controls (p = 0.930 by the Wilcoxon rank sum test).
Figure 2
Figure 2
Differences in beta diversity between colorectal cancer patients (CRC) and healthy controls (H). PCoA plots display the dissimilarity in gut microbiome composition between the two groups. (a) PCoA plot based on Jaccard distance shows a significant structural difference in microbial community between CRC patients and healthy controls in terms of presence-absence (MiRKAT p < 0.001). (b) PCoA based on Aitchison distance shows a significant structural difference in microbial community between CRC patients and healthy controls in terms of abundance (MiRKAT p < 0.001).
Figure 3
Figure 3
Heatmap of CLR-transformed abundances of the top 25 most common bacterial taxa. Each row (y-axis) represents a taxon, and each column (x-axis) corresponds to a subject. CRC indicates colorectal cancer patients and H indicates healthy controls. The color intensity represents the CLR-transformed abundance of each taxon. Subjects are hierarchically clustered based on their gut microbial profiles, with no distinct separation between CRC patients and healthy controls.
Figure 4
Figure 4
Differentially abundant taxa between colorectal cancer patients (CRC) and healthy controls (Healthy or Non-CRC). (a) Summary of differentially abundant taxa identified by ANCOM-BC, LEfSe, and sccomp, with red dots indicating identified taxa. (b) Log fold change (LFC) by ANCOM-BC, quantifying effect sizes of the identified taxa, with positive values reflecting enrichment in CRC patients. (c) Discriminant analysis (LDA) score by LEfSe, quantifying effect sizes of the identified taxa, with positive values reflecting enrichment in CRC patients. (d) Differential composition analysis results by sccomp. Error bars represent 95% credible intervals, with grey dashed vertical lines indicating the minimal effect size for significance (0.2 fold-change), red lines denoting non-significant results and blue lines indicating significant ones.

Similar articles

References

    1. Sung H., Ferlay J., Siegel R.L., Laversanne M., Soerjomataram I., Jemal A., Bray F. Global cancer statistics 2020: GLOBOCAN estimates of incidence and mortality worldwide for 36 cancers in 185 countries. CA Cancer J. Clin. 2021;71:209–249. doi: 10.3322/caac.21660. - DOI - PubMed
    1. Jemal A., Bray F., Center M.M., Ferlay J., Ward E., Forman D. Global cancer statistics. CA Cancer J. Clin. 2011;61:69–90. doi: 10.3322/caac.20107. - DOI - PubMed
    1. Nakatsu G., Li X., Zhou H., Sheng J., Wong S.H., Wu W.K.K., Ng S.C., Tsoi H., Dong Y., Zhang N., et al. Gut mucosal microbiome across stages of colorectal carcinogenesis. Nat. Commun. 2015;6:8727. doi: 10.1038/ncomms9727. - DOI - PMC - PubMed
    1. Yachida S., Mizutani S., Shiroma H., Shiba S., Nakajima T., Sakamoto T., Watanabe H., Masuda K., Nishimoto Y., Kubo M., et al. Metagenomic and metabolomic analyses reveal distinct stage-specific phenotypes of the gut microbiota in colorectal cancer. Nat. Med. 2019;25:968–976. doi: 10.1038/s41591-019-0458-7. - DOI - PubMed
    1. Yang L., Li A., Wang Y., Zhang Y. Intratumoral microbiota: Roles in cancer initiation, development and therapeutic efficacy. Signal Transduct. Target. Ther. 2023;8:35. doi: 10.1038/s41392-022-01304-4. - DOI - PMC - PubMed

LinkOut - more resources