. 2025 Apr 10;17(8):1282.
doi: 10.3390/cancers17081282.

Impact of Tyrosine Kinase Inhibitors on the Expression Pattern of Epigenetic Regulators

Affiliations

Impact of Tyrosine Kinase Inhibitors on the Expression Pattern of Epigenetic Regulators

Klaudia Tóth et al. Cancers (Basel). .

Abstract

Background: Advances in molecular genetic diagnostics and emerging opportunities for targeted treatment have opened new horizons in precision oncology. Tyrosine kinase inhibitors (TKI) are the subgroup of these agents with which the most clinical experience has been gathered so far. However, little data is available on the effect of TKI agents on the expression levels of molecules responsible for epigenetic regulation. Methods: In this study, we investigated the effect of in vitro and in vivo treatment with tyrosine kinase inhibitor agents on the expression of epigenetic regulators in hematological malignancies and solid tumors, based on data included in the functional genomics repository Gene Expression Omnibus. Results: Statistical analysis of datasets and series of gene expression patterns revealed numerous significant changes in the levels of epigenetic writers, erasers, microRNAs and members of chromatin-remodeling complexes following TKI treatment. Previously published data about the role of these epigenetic modifiers in malignant diseases has also been summarized. Conclusions: Our results may contribute to the establishment of novel treatment strategies aiming at the combinatorial administration of TKI and epidrugs in cancer, leading to less toxic therapy with further improved results.

Keywords: epigenetics; precision oncology; tyrosine kinase inhibitors.


Conflict of interest statement

The authors declare no conflicts of interest.

Figures

Figure 1
Figure 1
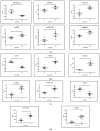
(a) GSE37418. Novel mutations target distinct subgroups of medulloblastoma. miR4454, miR100HG and ASXL3 epigenetic regulators were selected from those 200 genes that showed the greatest difference in expression levels in the case of untreated medulloblastoma subtypes. Statistical analysis was performed using the Kruskal–Wallis test. At a significance level of 5%, we observed significant differences in the values of these epigenetic regulators in several cases when comparing the individual medulloblastoma subgroups. *** p < 0.001, ** p < 0.01, * p < 0.05; WNT n = 8, SHH n = 10, G3 n = 16, G4 n = 39. (b) GSE28703. Discovery of novel recurrent mutations and rearrangements in early T-cell precursor acute lymphoblastic leukemia by whole genome sequencing. SMARCA2, HDAC9 and CITED2 epigenetic regulators were selected from those 200 genes that showed the greatest difference in expression levels in the case of comparing ETP and non-ETP ALL. Statistical analysis was performed using the Mann–Whitney test. At a significance level of 5%, we observed significant differences in the values of these epigenetic regulators when comparing the ALL subgroups. *** p < 0.001, ETP-ALL n = 12, non-ETP ALL n = 40.
Figure 1
Figure 1
(a) GSE37418. Novel mutations target distinct subgroups of medulloblastoma. miR4454, miR100HG and ASXL3 epigenetic regulators were selected from those 200 genes that showed the greatest difference in expression levels in the case of untreated medulloblastoma subtypes. Statistical analysis was performed using the Kruskal–Wallis test. At a significance level of 5%, we observed significant differences in the values of these epigenetic regulators in several cases when comparing the individual medulloblastoma subgroups. *** p < 0.001, ** p < 0.01, * p < 0.05; WNT n = 8, SHH n = 10, G3 n = 16, G4 n = 39. (b) GSE28703. Discovery of novel recurrent mutations and rearrangements in early T-cell precursor acute lymphoblastic leukemia by whole genome sequencing. SMARCA2, HDAC9 and CITED2 epigenetic regulators were selected from those 200 genes that showed the greatest difference in expression levels in the case of comparing ETP and non-ETP ALL. Statistical analysis was performed using the Mann–Whitney test. At a significance level of 5%, we observed significant differences in the values of these epigenetic regulators when comparing the ALL subgroups. *** p < 0.001, ETP-ALL n = 12, non-ETP ALL n = 40.
Figure 2
Figure 2
(a) GSE66346. Expression data from renal cancer xenograft tumor treated with sunitinib or vehicle. SMARCAL2, miR200C, miR323A, miR382, miR516B1 and miR664B epigenetic regulators were selected from those 200 genes that showed the greatest difference in expression levels in the case of comparing sunitinib-treated and untreated renal cancer xenograft. Statistical analysis was performed using the Mann–Whitney test. At a significance level of 5%, we observed significant differences in the values of these epigenetic regulators when comparing the treated and untreated renal cancer subgroups. * p < 0.05, T = treated n = 5, NT = not treated n = 4. (b) GSE197555. Differential mRNA expression analysis of H460 cells and A549 cells after trametinib treatment. CHD4, DPY30 and miR614 epigenetic regulators were selected from those 200 genes that showed the greatest difference in expression levels in the case of comparing trametinib-treated and untreated NSCLC H460 and A459 cells. Statistical analysis was performed using the Mann–Whitney test. At a significance level of 5%, we observed significant differences in the values of these epigenetic regulators when comparing the treated and untreated NSCLC subgroups. ** p < 0.01, T = treated n = 6, NT = not treated n = 6. (c) GSE59357. Gene expression profiles of dasatinib-resistant and dasatinib-sensitive pancreatic cancer cell lines. CITED2, SMARCD3 and miR132 epigenetic regulators were selected from those 200 genes that showed the greatest difference in expression levels in the case of comparing dasatinib-sensitive and dasatinib-resistant pancreatic cancer cells. Statistical analysis was performed using the Mann–Whitney test. At a significance level of 5%, we observed significant differences in the values of these epigenetic regulators when comparing the sensitive and resistant pancreatic cancer subgroups, p < 0.001, S = sensitive n = 9, R = resistant n = 9. (d) GSE98314. Melanoma cell lines treated with dabrafenib ± trametinib. HIST1H4C and UHRF1 epigenetic regulators were selected from those 200 genes that showed the greatest difference in expression levels in the case of comparing dabrafenib-treated and untreated melanoma cells. Statistical analysis was performed using the Kruskal–Wallis test. At a significance level of 5%, we observed significant differences in the values of these epigenetic regulators when comparing the treated and untreated melanoma subgroups, *** p < 0.001, ** p < 0.01, T = treated with dabrafenib n = 7, NT = not treated n = 11.
Figure 3
Figure 3
(a) GSE218183. Bulk RNA-seq analysis of primary CML CD34+ cells (n = 3) treated with idasanutlin alone or in combination with nilotinib in vitro. miR3652, H4C1 and HDAC1 epigenetic regulators were selected from those 200 genes that showed the greatest difference in expression levels in the case of comparing nilotinib- and idasanutlin-treated and untreated CML cells. Statistical analysis was performed using the Kruskal-Wallis test. At a significance level of 5%, we observed significant differences in the values of the miR3652 epigenetic regulator when comparing the treated and untreated CML cells subgroups. * p < 0.05, T = treated nilotinib n = 3, idasanutlin n = 2, nilotinib plus idasanutlin n = 3, NT = not treated n = 3, ns = not significant. (b) GSE171763. Inhibitors of Bcl-2 and Bruton’s tyrosine kinase synergize to abrogate diffuse large B-cell lymphoma (DLBCL) growth. PHF6, H2BC20P and JMJD6 epigenetic regulators were selected from those 200 genes that showed the greatest difference in expression levels in the case of comparing ibrutinib-treated and untreated DLBCL cells. Statistical analysis was performed using the Mann–Whitney test. At a significance level of 5%, we observed significant differences in the values of these epigenetic regulators when comparing the treated and untreated DLBCL cells subgroups. *** p < 0.001, ** p < 0.01. T = treated n = 15, NT = not treated n = 9. (c) GSE173306. Transcription profiling of ALK-rearranged cell lines resistant and sensitive to crizotinib. SRSF6, AGO4, BRWD3, KDM6B, PHF21A and BRWD1 epigenetic regulators were selected from those 200 genes that showed the greatest difference in expression levels in the case of comparing crizotinib-treated and untreated ALCL cells. Statistical analysis was performed using the Mann–Whitney test. At a significance level of 5%, we observed significant differences in the values of SRSF6, AGO4, BRWD3, KDM6B and PHF21A epigenetic regulators when comparing the treated and untreated ALCL cells subgroups. ** p < 0.01, * p < 0.05, T = treated n = 7, NT = not treated n = 7.
Figure 4
Figure 4
GSE29828. Expression Profiling of Mixed Lineage Leukemia Cells Treated with a Potent Small-Molecule DOT1L Inhibitor. AGO1, AGO4, JMJD6, SRSF8, miR15A, miR6758, miR6787, miR6836 and miR6890 epigenetic regulators were selected from those 200 genes that showed the greatest difference in expression levels in the case of comparing DOT1L inhibitor-treated and untreated AML cells. Statistical analysis was performed using the Mann–Whitney test. At a significance level of 5%, we observed significant differences in the values of these epigenetic regulators when comparing the treated and untreated AML subgroups. *** p < 0.001, T = treated n = 12, NT = not treated n = 6.
Figure 4
Figure 4
GSE29828. Expression Profiling of Mixed Lineage Leukemia Cells Treated with a Potent Small-Molecule DOT1L Inhibitor. AGO1, AGO4, JMJD6, SRSF8, miR15A, miR6758, miR6787, miR6836 and miR6890 epigenetic regulators were selected from those 200 genes that showed the greatest difference in expression levels in the case of comparing DOT1L inhibitor-treated and untreated AML cells. Statistical analysis was performed using the Mann–Whitney test. At a significance level of 5%, we observed significant differences in the values of these epigenetic regulators when comparing the treated and untreated AML subgroups. *** p < 0.001, T = treated n = 12, NT = not treated n = 6.

Similar articles

References

    1. Quaresma M., Coleman M.P., Rachet B. 40-year trends in an index of survival for all cancers combined and survival adjusted for age and sex for each cancer in England and Wales, 1971-2011: A population-based study. Lancet. 2015;385:1206–1218. doi: 10.1016/S0140-6736(14)61396-9. - DOI - PubMed
    1. Tonorezos E., Devasia T., Mariotto A.B., Mollica M.A., Gallicchio L., Green P., Doose M., Brick R., Streck B., Reed C., et al. Prevalence of cancer survivors in the United States. J. Natl. Cancer Inst. 2024;116:1784–1790. doi: 10.1093/jnci/djae135. - DOI - PMC - PubMed
    1. Botta L., Gatta G., Capocaccia R., Stiller C., Cañete A., Dal Maso L., Innos K., Mihor A., Erdmann F., Spix C., et al. Long-term survival and cure fraction estimates for childhood cancer in Europe (EUROCARE-6): Results from a population-based study. Lancet Oncol. 2022;23:1525–1536. doi: 10.1016/S1470-2045(22)00637-4. - DOI - PubMed
    1. Casolino R., Beer P.A., Chakravarty D., Davis M.B., Malapelle U., Mazzarella L., Normanno N., Pauli C., Subbiah V., Turnbull C., et al. Interpreting and integrating genomic tests results in clinical cancer care: Overview and practical guidance. CA Cancer J. Clin. 2024;74:264–285. doi: 10.3322/caac.21825. - DOI - PubMed
    1. Pomerantz B.J. Imaging and Interventional Radiology for Cancer Management. Surg. Clin. N. Am. 2020;100:499–506. doi: 10.1016/j.suc.2020.02.002. - DOI - PubMed

LinkOut - more resources