

Transcriptome-Metabolome Analysis Reveals That Crossbreeding Improves Meat Quality in Hu Sheep and Their F1-Generation Sheep
- PMID: 40282783
- PMCID: PMC12026837
- DOI: 10.3390/foods14081384
Transcriptome-Metabolome Analysis Reveals That Crossbreeding Improves Meat Quality in Hu Sheep and Their F1-Generation Sheep
Abstract
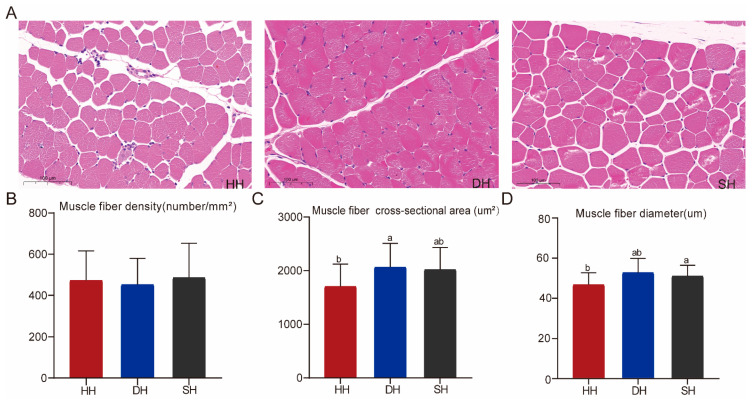
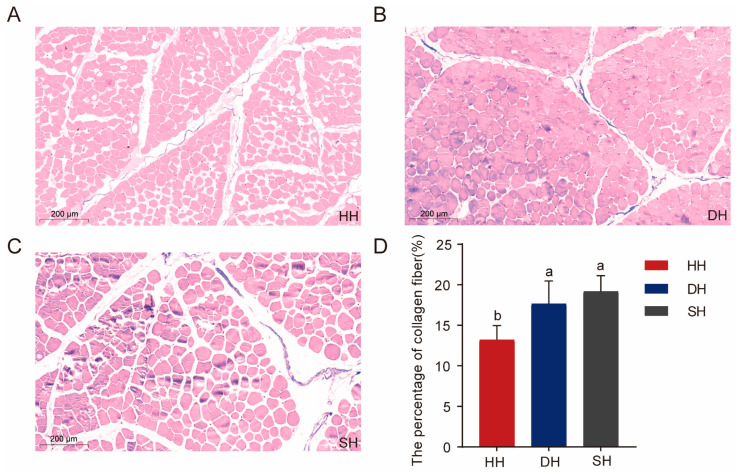
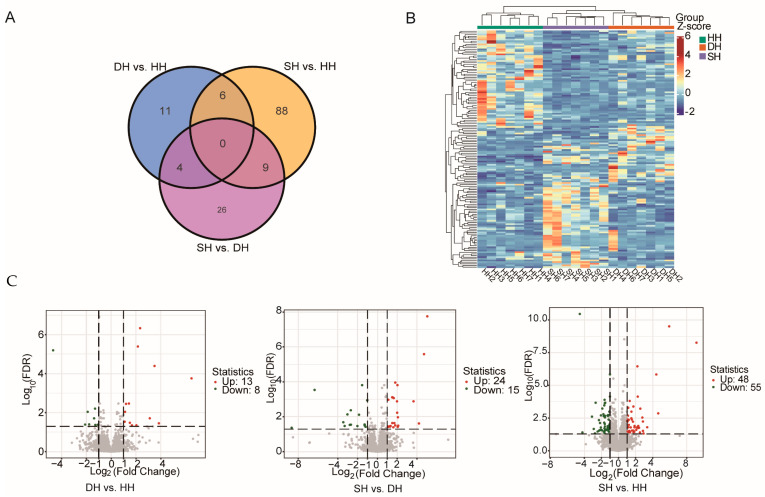
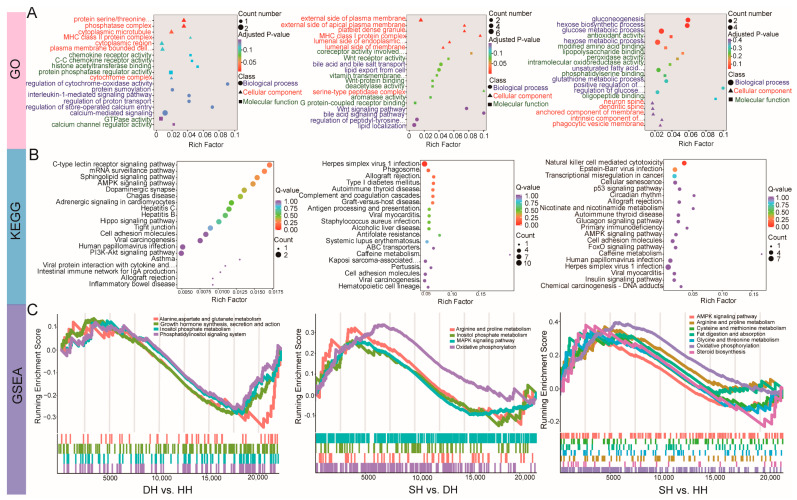
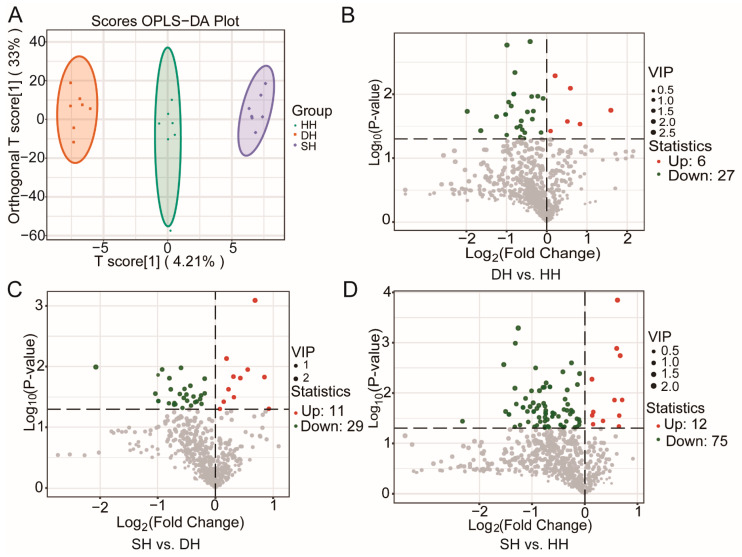
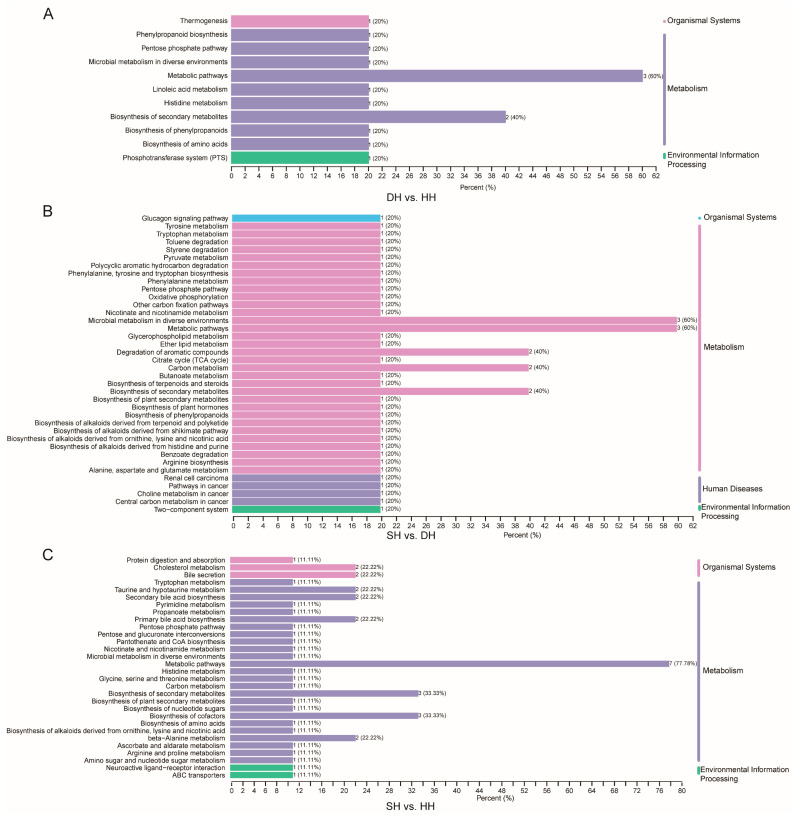
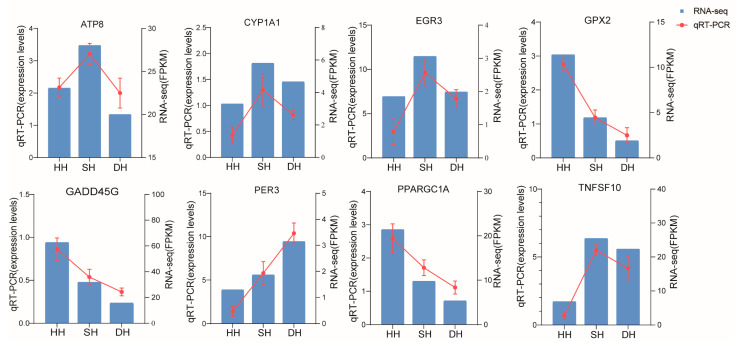
Consumers are increasingly demanding higher-quality mutton. Crossbreeding has been recognized as an effective means to improve meat quality. However, the phenomenon underlying these molecular system mechanisms remains largely unidentified. In this study, 48 male lambs aged 3 months were selected, including ♂ Hu sheep × ♀ Hu (HH, n = 16), ♂ Polled Dorset × ♀ Hu sheep F1 hybrid lambs (DH, n = 16), and ♂ Southdown × ♀ Hu sheep (SH, n = 16) F1 hybrid lambs, and raised in a single pen under the same nutritional and management conditions for 95 days. Then, seven sheep close to the average weight of the group were selected and fasted for 12 h prior to slaughter. By comparing the muscle fiber characteristics of the Longissimus dorsi of the three groups of sheep, and through transcriptomic and metabolomic analyses, we revealed molecular differences in the meat quality of Hu sheep crossbred with different parent breeds. The results of this study showed that muscle fiber diameter and cross-sectional area were significantly greater in the DH group than in the HH group, and collagen fiber content in the DH group was also significantly higher than in the HH group (p < 0.05). A total of 163 differential genes and 823 differential metabolites were identified in the three groups, most of which were related to muscle development and lipid metabolism. These included the AMPK signaling pathway, the PI3K-Akt signaling pathway, glycerophospholipid metabolism, and the related genes EFHB, PER3, and PPARGC1A. The results of this study offer valuable insights into the molecular mechanisms underlying the impact of crossbreeding on meat quality and provide a theoretical foundation for sheep crossbreed production.
Keywords: crossbreed; longissimus dorsi; meat quality; metabolomics; transcriptomics.
Conflict of interest statement
The authors declare that there are no conflicts of interest.
Figures

Similar articles
-
Transcriptomics and metabolomics reveal improved performance of Hu sheep on hybridization with Southdown sheep.Food Res Int. 2023 Nov;173(Pt 1):113240. doi: 10.1016/j.foodres.2023.113240. Epub 2023 Jul 11. Food Res Int. 2023. PMID: 37803553
-
Transcriptome-metabolome analysis reveals how sires affect meat quality in hybrid sheep populations.Front Nutr. 2022 Aug 11;9:967985. doi: 10.3389/fnut.2022.967985. eCollection 2022. Front Nutr. 2022. PMID: 36034900 Free PMC article.
-
Effect of crossbreeding and sex on slaughter performance and meat quality in Xingguo gray goose based on multiomics data analysis.Poult Sci. 2023 Aug;102(8):102753. doi: 10.1016/j.psj.2023.102753. Epub 2023 May 23. Poult Sci. 2023. PMID: 37267641 Free PMC article.
-
Hybridization promotes growth performance by altering rumen microbiota and metabolites in sheep.Front Vet Sci. 2024 Sep 25;11:1455029. doi: 10.3389/fvets.2024.1455029. eCollection 2024. Front Vet Sci. 2024. PMID: 39386242 Free PMC article.
-
Review of Huang-huai sheep, a new multiparous mutton sheep breed first identified in China.Trop Anim Health Prod. 2020 Nov 23;53(1):35. doi: 10.1007/s11250-020-02453-w. Trop Anim Health Prod. 2020. PMID: 33230646 Free PMC article. Review.
References
Grants and funding
- CAAS-ZDRW202502/the Major Scientific Research Task of the Science and Technology Innovation Project of the Chinese Academy of Agricultural Sciencesx
- 22ZD6NA037, 21ZD11NM001/the Science and Technology Program of Gansu Province
- Y2024YJ08, 1610322024020/the Central Public interest Scientific Institution Basal Research Fund
- GYGG-2024-6/the Seed Industry Breakthrough Project of Gansu Province
- HNK 2023-09/the Science and Technology Bureau Project of Huan County
LinkOut - more resources
Full Text Sources
