. 2025 Mar 30;61(4):633.
doi: 10.3390/medicina61040633.

Gut Microbiota-Based Immunotherapy: Engineered Escherichia coli Nissle 1917 for Oral Delivery of Glypican-1 in Pancreatic Cancer

Affiliations

Gut Microbiota-Based Immunotherapy: Engineered Escherichia coli Nissle 1917 for Oral Delivery of Glypican-1 in Pancreatic Cancer

Idris Vruzhaj et al. Medicina (Kaunas). .

Abstract

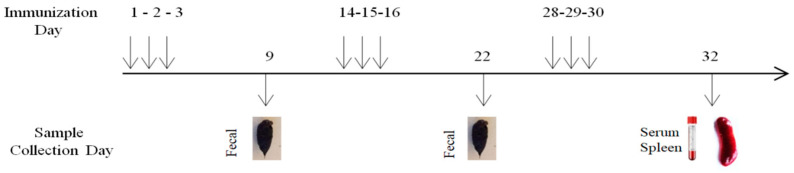
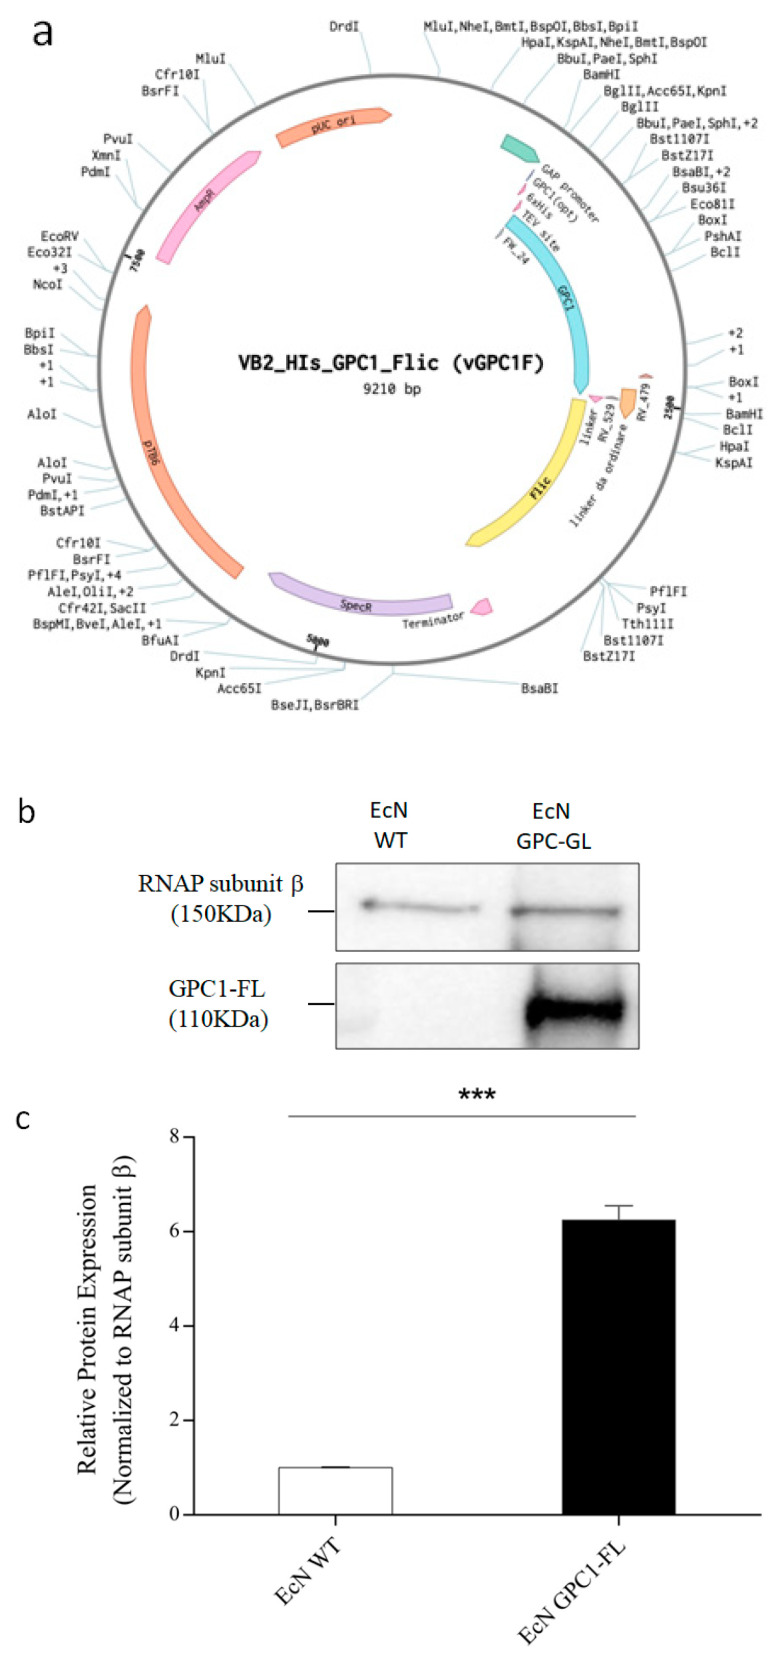
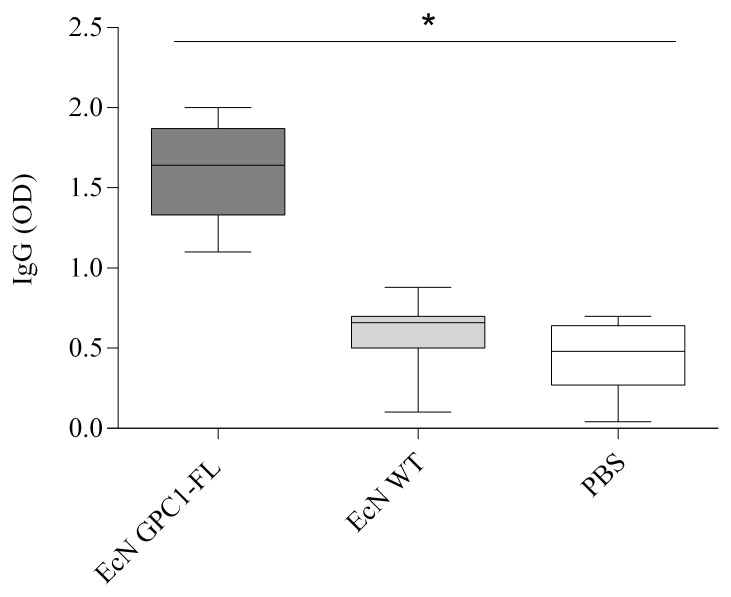
Background and Objectives: The administration of oral vaccines offers a potential strategy for cancer immunotherapy; yet, the development of effective platforms continues to pose a difficulty. This study examines Escherichia coli Nissle 1917 (EcN) as a microbial vector for the precise delivery of Glypican-1 (GPC1), a tumor-associated antigen significantly overexpressed in pancreatic ductal adenocarcinoma (PDAC).To evaluate the effectiveness of EcN as a vector for the delivery of GPC1 and assess its potential as an oral vaccination platform for cancer immunotherapy. Materials and Methods: EcN was genetically modified to produce a GPC1-flagellin fusion protein (GPC1-FL) to augment antigen immunogenicity. The expression and stability of GPC1 were confirmed in modified PANC02 cells using Western blot and flow cytometry, indicating that GPC1 expression did not influence tumor cell growth. A mouse model was employed to test immunogenicity post-oral delivery, measuring systemic IgG, IL-10, IL-2, and IFN-γ levels to indicate immune activation. Results: Oral immunization with EcN GPC1-FL elicited a robust systemic immune response, demonstrated by markedly increased levels of IgG and IL-10. IL-2 and IFN-γ concentrations were elevated in vaccinated mice relative to controls; however, the differences lacked statistical significance. Western blot examination of fecal samples verified consistent antigen expression in the gastrointestinal tract, indicating effective bacterial colonization and antigen retention. No detrimental impacts were noted, hence substantiating the safety of this methodology. Conclusions: These findings confirm EcN as a feasible and patient-friendly oral vaccination platform for cancer immunotherapy. The effective production of GPC1 in tumor cells, along with continuous antigen delivery and immune activation, underscores the promise of this approach for PDAC and other cancers. This study promotes microbial-based antigen delivery as a scalable, non-invasive substitute for traditional vaccine platforms.

Keywords: Escherichia coli Nissle 1917; Glypican-1; immunotherapy; oral vaccine delivery; pancreatic cancer vaccines.


Conflict of interest statement

The authors declare no conflicts of interest.

Figures

Figure 1
Figure 1
Visualizing immunization: a schematic overview.
Figure 2
Figure 2
Development and Verification of GPC1 and GPC1-Flagellin Expression in Escherichia coli Nissle. (a): Diagram Description: The diagram depicts the composition of the pVB2gpc1 vector, which is designed for the production of GPC1 and the GPC1-Flagellin fusion protein. The diagram highlights key genetic components, such as the GAP promoter for consistent gene expression, optimized GPC1 cDNA for increased production in bacteria, integration of the FliC gene from Salmonella Typhimurium to enhance immunogenicity, and transcriptional terminators to mark the end of the transcription unit. (b): The Western blot (b) and the corresponding quantitative graph (c) present protein samples from EcN-WT and EcN GPC-FL. The RNA polymerase subunit β (RNAP subunit β, 150 kDa) functioned as a loading control to verify uniform protein loading across lanes. The GPC1-Flagellin (GPC1-FL, 110 kDa), was distinctly expressed alone in the transfected EcN (EcN GPC1-FL), signifying effective transfection and expression. Protein expression was measured using ImageJ software version 1.42, adjusted to RNAP subunit β, and the results indicated that expression levels of GPC1-FL were considerably elevated in the transfected strain relative to the wild type (*** p < 0.001). The experiment was conducted thrice, highlighting the reliable and effective augmentation of GPC1-FL transfected EcN.
Figure 3
Figure 3
An analysis of GPC1 protein expression and proliferation in engineered PANC02 cells. (a): GPC1 protein expression in PANC02 cells. The picture illustrates a Western blot study contrasting GPC1 protein expression in wild-type (WT) and genetically modified PANC02 cells (T-GPC1 PANC02). The upper panel indicates the presence of GPC1 (65 kDa) solely in the transfected cells, while it is lacking in WT cells. GAPDH (37 kDa) serves as a loading control, guaranteeing uniform protein loading among the samples. The lower panel quantifies relative protein expression, normalized to GAPDH, demonstrating a considerably elevated expression of GPC1 in T-GPC1 PANC02 cells compared to WT, as denoted by the triple asterisks (*** p < 0.001). (b): Flow cytometry for GPC1 surface expression: The flow cytometry data show a notable elevation in the expression of GPC1 on the surface of T-GPC1 PANC02 cells as compared to the WT group. The increased expression on the surface of the cell provides evidence for the functional existence of GPC1 as a result of the transfection. (c): Cell doubling time analysis: This graph presents a comparison of the cell doubling durations between WT and T-GPC1 PANC02 cells. The data indicates that the introduction and subsequent activation of GPC1 through transfection does not have a detrimental effect on the growth rate of the cells, suggesting that the normal course of the cell cycle is maintained. Statistical analysis: The statistical significance was evaluated using an unpaired t-test. Significant differences in GPC1 surface expression between the wild-type (WT) and T-GPC1 PANC02 cells were seen at a p-value below < 0.001.
Figure 4
Figure 4
Body weight changes following oral vaccinations. This graph illustrates the weekly body weights of mice, with a sample size of 5 per group, who were administered EcN GPC1-FL, EcN WT, or PBS. Each data point represents the mean value of the group, while the error bars indicate the standard error (±SE). The mean body weight trends for all treatment groups exhibit typical growth, with no statistically significant deviations observed among the groups.
Figure 5
Figure 5
Specific expression of GPC1-FL in engineered EcN post-vaccination. The data illustrate Western blot (a) and densitometric analysis (b) of GPC1-FL in EcN obtained from mouse feces following oral immunization. Feces from three mice in each immunized group (EcN GPC1-FL and EcN WT) were utilized for Western blotting. The beta component of RNA polymerase (150 kDa) functioned as a loading control to verify uniform protein loading among the samples. The presence of GPC1-FL (110 kDa) was verified in the re-isolated EcN GPC1-FL, demonstrating persistent gene expression following immunization. Expression was measured via ImageJ and normalized to RNA polymerase β, indicating consistently elevated levels of GPC1-FL (*** p < 0.001).
Figure 6
Figure 6
Box and whisker plot of IgG antibody levels following vaccination with EcN-GPC1-FL.
Figure 7
Figure 7
Box and whisker plots of IL-2 and IFN-γ levels post-vaccination. (A). IFN-γ levels: The graph displays IFN-γ concentrations in cell cultures activated by PANC02-GPC1 or PANC02, 30 days following immunization with EcN GPC1-FL, EcN WT, or PBS. The vaccinated group exhibited increased IFN-γ levels under both re-stimulated (RS) and non-stimulated (NS) conditions; however, no significant differences were noted between the groups. (B). IL-2 Levels: Likewise, IL-2 concentrations were elevated in the EcN GPC1-FL group relative to the other groups under both re-stimulated (RS) and non-stimulated (NS) circumstances. Nonetheless, no statistically significant differences were detected.
Figure 8
Figure 8
Serum IL-10 levels indicative of immune regulatory activity post-vaccination.

Similar articles

References

    1. Stoffel E.M., Brand R.E., Goggins M. Pancreatic Cancer: Changing Epidemiology and New Approaches to Risk Assessment, Early Detection, and Prevention. Gastroenterology. 2023;164:752–765. - PMC - PubMed
    1. Usami M., Kikuchi S., Takada K., Ono M., Sugama Y., Arihara Y., Hayasaka N., Nakamura H., Ikeda Y., Hirakawa M., et al. FOXO3a Activation by HDAC Class IIa Inhibition Induces Cell Cycle Arrest in Pancreatic Cancer Cells. Pancreas. 2020;49:135–142. doi: 10.1097/MPA.0000000000001462. - DOI - PubMed
    1. Warshaw A.L., Castillo C.F.-d. Pancreatic Carcinoma. N. Engl. J. Med. 1992;326:455–465. - PubMed
    1. Fathi M., Ghafouri-Fard S., Abak A., Taheri M. Emerging roles of miRNAs in the development of pancreatic cancer. Biomed. Pharmacother. = Biomed. Pharmacother. 2021;141:111914. - PubMed
    1. Sohal D.P., Mangu P.B., Khorana A.A., Shah M.A., Philip P.A., O’reilly E.M., Uronis H.E., Ramanathan R.K., Crane C.H., Engebretson A., et al. Metastatic Pancreatic Cancer: American Society of Clinical Oncology Clinical Practice Guideline. JCO. 2016;34:2784–2796. - PMC - PubMed

LinkOut - more resources