

Prediction Model for Risk of Death in Elderly Critically Ill Patients with Kidney Failure
- PMID: 40282936
- PMCID: PMC12028376
- DOI: 10.3390/medicina61040640
Prediction Model for Risk of Death in Elderly Critically Ill Patients with Kidney Failure
Abstract
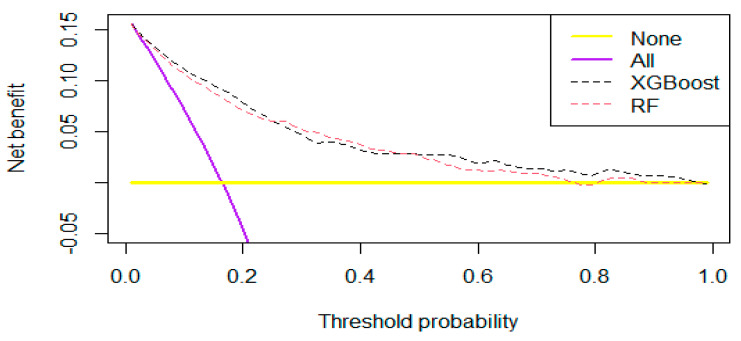
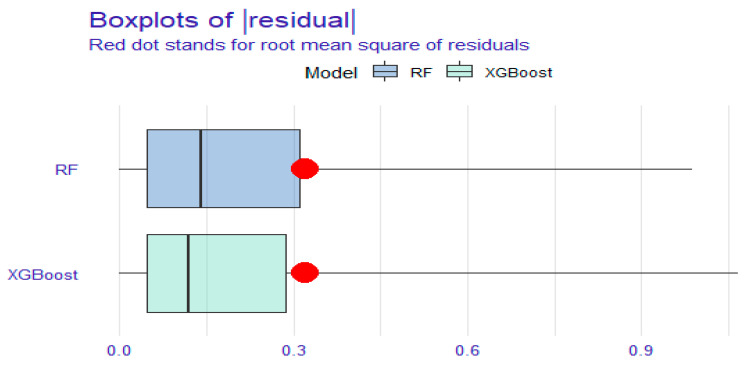
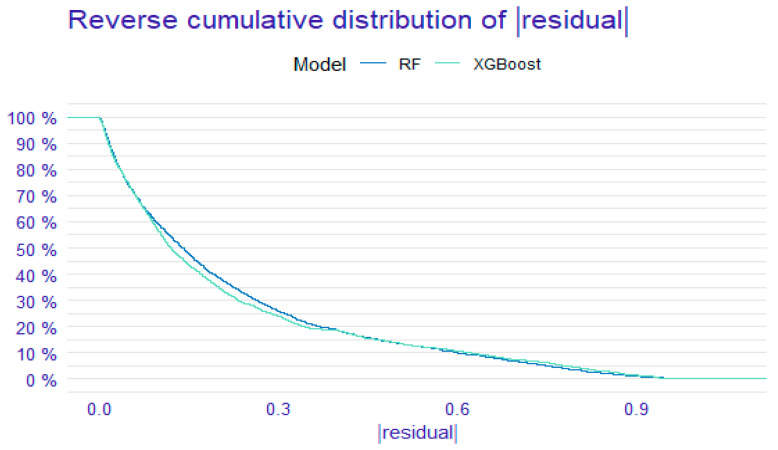
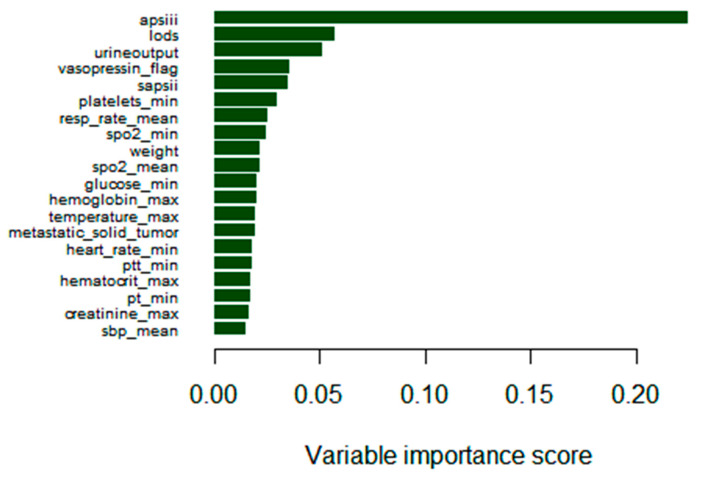
Background and Objectives: Kidney failure (KF) is associated with high mortality, especially among critically ill patients in the intensive care unit (ICU). Conversely, age is an independent risk factor for the development of KF. Therefore, understanding the mortality risk profile of elderly critically ill patients with KF can help clinicians in implementing appropriate measures to improve patients' prognosis. The aim of this study was to construct high-performance mortality risk prediction models for elderly ICU patients with KF using machine learning methods. Materials and Methods: Elderly (≥65 years) ICU patients diagnosed with KF were selected and relevant information (including demographic details, vital signs, laboratory tests, etc.) was collected. They were randomly divided into training, validation, and test sets in a 6:2:2 ratio. Logistic regression (LR), random forest (RF), support vector machine (SVM), and extreme gradient boosting (XGBoost) methods were employed to develop prediction models for the risk of death in these elderly KF patients. The model's performance was evaluated by the receiver operating characteristic curve, precision rate, recall rate, and decision curve analysis. Finally, breakdown plots were utilized to analyze the mortality risk of elderly KF patients. Results: A total of 8010 elderly ICU patients with KF were included in this study, among whom 1385 patients died. Mortality prediction models were constructed using various methods, with the areas under the curve (AUC) for the different models being 0.835 (LR model), 0.839 (RF model), 0.784 (SVM model), and 0.851 (XGBoost model), respectively. The integrated Brier score (IBS) for these models were 0.206 (LR model), 0.158 (RF model), 0.217 (SVM model), and 0.102 (XGBoost model), indicating that the XGBoost model and RF model exhibited superior differentiation and calibration capacity. Further analysis revealed that the XGBoost model outperformed the others in terms of both prediction accuracy and stability. Finally, based on the ranking of important features, the primary influencing factors for elderly KF patients were identified as urine output, metastatic solid tumor, body weight, body temperature, and severity score. Conclusions: Several high-performing predictive models for mortality risk in elderly ICU patients with KF have been developed using various machine learning algorithms, with the XGBoost model demonstrating the best performance.
Keywords: intensive care unit; kidney failure; machine learning; mortality risk; the elderly.
Conflict of interest statement
The authors declare that they have no competing interests.
Figures


References
-
- Sobamowo H., Prabhakar S.S. The kidney in aging: Physiological changes and pathological implications. Prog. Mol. Biol. Transl. Sci. 2017;146:303–340. - PubMed
-
- Clingan M.J., Zhang Z., Caserta M.P., Cox K.L., Gupta V., Baumgarten D.A., Zhai Q., Alexander L.F. Imaging Patients with Kidney Failure. Radiographics. 2023;43:e220116. - PubMed
-
- Houwelingen S. Ridge Estimators in Logistic Regression. J. R. Stat. Soc. Ser. C. 1992;41:191–201.
MeSH terms
Grants and funding
LinkOut - more resources
Full Text Sources
