

The Nutritional Phenotyping of Idiopathic Pulmonary Fibrosis Through Morphofunctional Assessment: A Bicentric Cross-Sectional Case-Control Study
- PMID: 40283071
- PMCID: PMC12029122
- DOI: 10.3390/life15040516
The Nutritional Phenotyping of Idiopathic Pulmonary Fibrosis Through Morphofunctional Assessment: A Bicentric Cross-Sectional Case-Control Study
Abstract
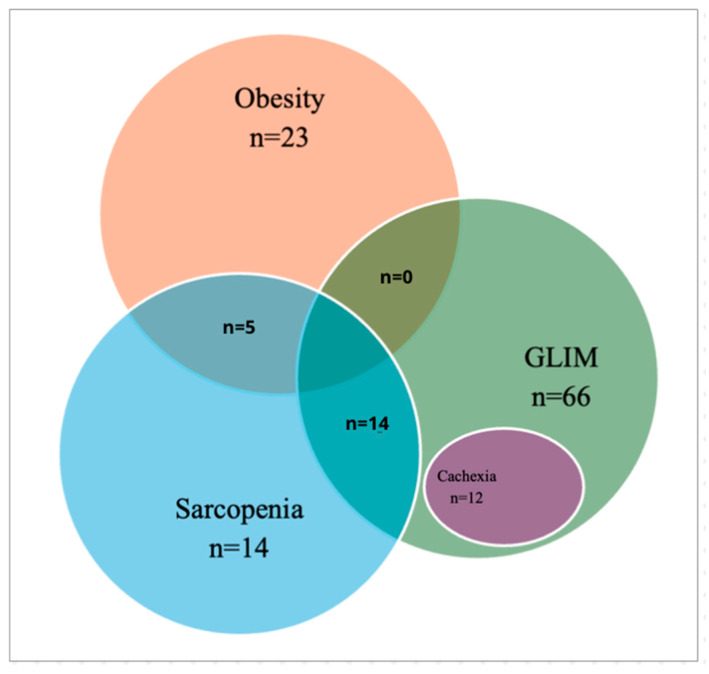
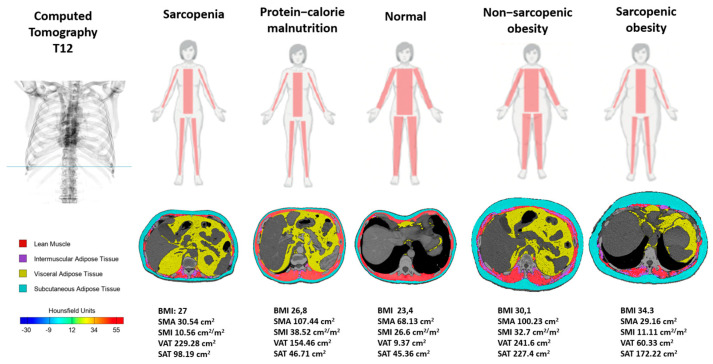
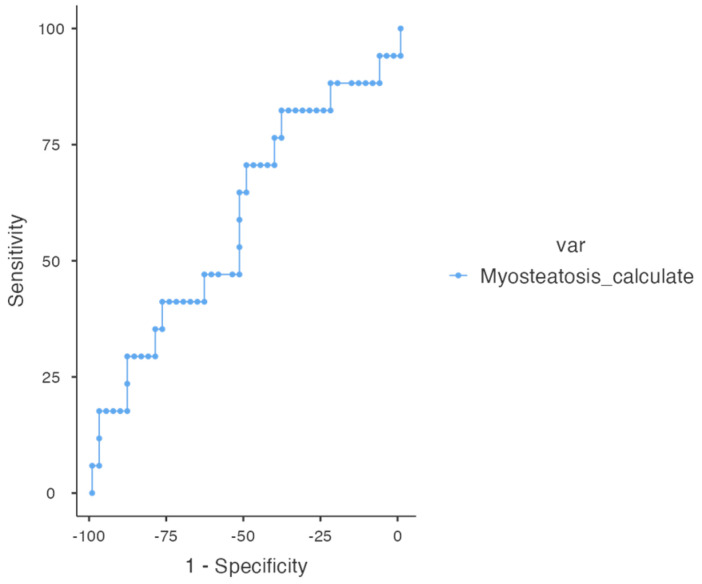
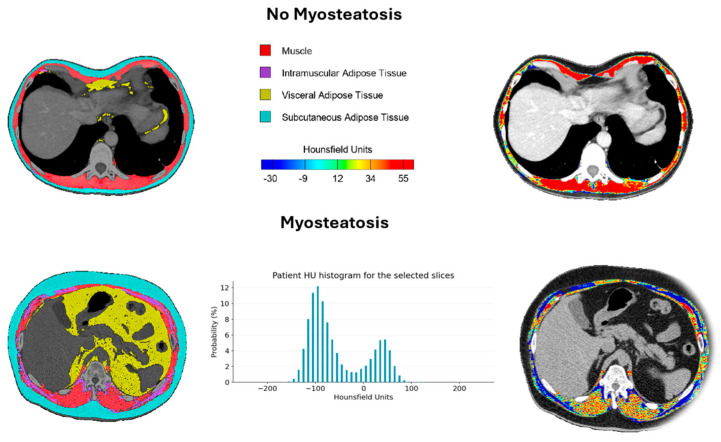
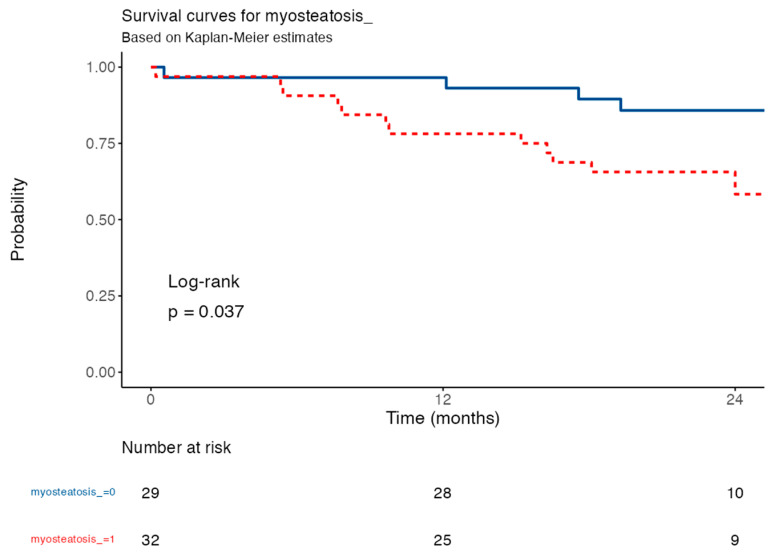
There is increasing evidence supporting the use of morphofunctional assessment (MFA) as a tool for clinical characterization and decision-making in malnourished patients. MFA enables the diagnosis of malnutrition, sarcopenia, obesity, and cachexia, leading to a novel phenotype-based classification of nutritional disorders. Bioelectrical impedance analysis (BIVA), nutritional ultrasound® (NU) and computed tomography (CT) are included, along with functional tests like the Timed Up and Go test (TUG). Myoesteatosis, detectable via CT, can occur independently from nutritional phenotypes and has been identified as a significant mortality predictor in idiophatic pulmonary fibrosis (IPF). Our aim is to analyze the prevalence and overlap of nutritional phenotypes in IPF and evaluate the prognostic value of myoesteatosis. Our bicenter cross-sectional study included 82 IPF patients (84.1% male and with a medium age of 71.1 ± 7.35 years). MFA was performed using BIVA, NU, CT at the T12 level (CT-T12), the handgrip strength (HGS) test, and the TUG. CT-T12 BC parameters were analyzed using FocusedON® software, while statistical analyses were conducted with JAMOVI version 2.3.22. All four major nutritional phenotypes were represented in our cohort, with significant overlap. A total of 80.5% met the GLIM criteria for malnutrition, 14.6% had cachexia, 17% were sarcopenic, and 28% were obese. Of the obese patients, 70% were also malnourished, while 100% of sarcopenic obese patients (5.9% of total) had malnutrition. A total of 55% of sarcopenic patients with available CT also had myosteatosis, suggesting muscle quality deterioration as a potential driver of functional impairment. The presence of myosteatosis > 15% in T12-CT was an independent predictor of 12-month mortality (HR = 3.13; 95% CI: 1.01-9.70; p = 0.049), with survival rates of 78.1% vs. 96.6% in patients with vs. without myosteatosis, respectively. To conclude, this study underscores the relevance of MFA in the nutritional characterization of patients with IPF, demonstrating its potential to identify specific phenotypes associated with malnutrition, functional impairment, and the presence of myoesteatosis, thereby providing a valuable tool for clinical decision-making.
Keywords: body composition; cachexia; computed tomography; idiopathic pulmonary fibrosis; malnutrition; morphofunctional assessment; myoesteatosis; sarcopenia; sarcopenic obesity.
Conflict of interest statement
The authors declare that the research was conducted in the absence of any commercial or financial relationships that could be construed as potential conflicts of interest.
Figures
References
-
- Raghu G., Collard H.R., Egan J.J., Martinez F.J., Behr J., Brown K.K., Colby T.V., Cordier J.-F., Flaherty K.R., Lasky J.A., et al. An Official ATS/ERS/JRS/ALAT Statement: Idiopathic Pulmonary Fibrosis: Evidence-based Guidelines for Diagnosis and Management. Am. J. Respir. Crit. Care Med. 2011;183:788–824. - PMC - PubMed
-
- Lederer D.J., Martinez F.J. Idiopathic Pulmonary Fibrosis. N. Engl. J. Med. 2018;378:1811–1823. - PubMed
-
- Çinkooğlu A., Bayraktaroğlu S., Ufuk F., Unat Ö.S., Köse T., Savaş R., Bishop N.M. Reduced CT-derived erector spinae muscle area: A poor prognostic factor for short- and long-term outcomes in idiopathic pulmonary fibrosis patients. Clin. Radiol. 2023;78:904–911. - PubMed
LinkOut - more resources
Full Text Sources
Research Materials
Miscellaneous
