

Accelerated Electro-Optic Switching in Liquid Crystal Devices via Ion Trapping by Dispersed Helical Carbon Nanotubes
- PMID: 40283332
- PMCID: PMC12029598
- DOI: 10.3390/mi16040457
Accelerated Electro-Optic Switching in Liquid Crystal Devices via Ion Trapping by Dispersed Helical Carbon Nanotubes
Abstract
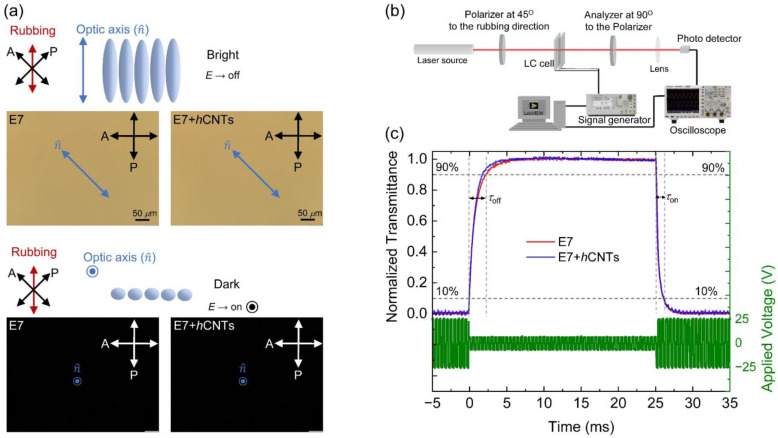
Free ion impurities in liquid crystals significantly impact the dynamic electro-optic performance of liquid crystal displays, leading to slow switching times, short-term flickering, and long-term image sticking. These ionic contaminants originate from various sources, including LC cell fabrication, electrode degradation, and organic alignment layers. This study demonstrates that doping LCs with a small concentration of helical carbon nanotubes effectively reduces free ion concentrations by approximately 70%. The resulting reduction in ionic impurities lowers the rotational viscosity of the LC, facilitating faster electro-optic switching. Additionally, the purified LC exhibits enhanced dielectric anisotropy, further improving its performance in display applications. These findings suggest that helical carbon nanotubes doping offers a promising approach for mitigating ion-related issues in liquid crystals without the need for additional chemical treatments, paving the way for an efficient liquid crystal display technology.
Keywords: electro-optic effects; helical carbon nanotubes; ionic impurities; liquid crystals.
Conflict of interest statement
The authors declare no conflict of interest.
Figures


References
-
- Heilmeier G.H., Heyman P.M. Note on Transient Current Measurements in Liquid Crystals and Related Systems. Phys. Rev. Lett. 1967;18:583–585. doi: 10.1103/PhysRevLett.18.583. - DOI
-
- Briere G., Gaspard F., Herino R. Ionic residual conduction in the isotropic phase of a nematic liquid crystal. Chem. Phys. Lett. 1971;9:285–288. doi: 10.1016/0009-2614(71)80221-X. - DOI
-
- Takahashi S. The investigation of a dc induced transient optical 30-Hz element in twisted nematic liquid-crystal displays. J. Appl. Phys. 1991;70:5346–5350. doi: 10.1063/1.350244. - DOI
-
- De Vleeschouwer H., Verweire B., D’Have K., Zhang H. Electrical and Optical Measurements of the Image Sticking Effect in Nematic LCD’S. Mol. Cryst. Liq. Cryst. 1999;331:567–574. doi: 10.1080/10587259908047559. - DOI
-
- De Vleeschouwer H., Bougrioua F., Pauwels H. Importance of Ion Transport in Industrial LCD Applications. Mol. Cryst. Liq. Cryst. 2001;360:29–39. doi: 10.1080/10587250108025696. - DOI
Grants and funding
LinkOut - more resources
Full Text Sources
