. 2025 Mar 23;18(4):448.
doi: 10.3390/ph18040448.

Preparation and Evaluation of Hepatoma-Targeting Glycyrrhetinic Acid Composite Micelles Loaded with Curcumin

Affiliations

Preparation and Evaluation of Hepatoma-Targeting Glycyrrhetinic Acid Composite Micelles Loaded with Curcumin

Xueli Guo et al. Pharmaceuticals (Basel). .

Abstract

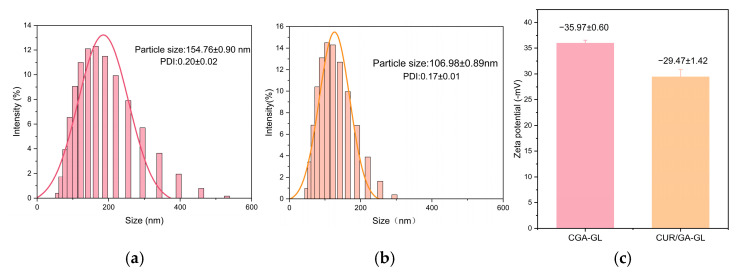
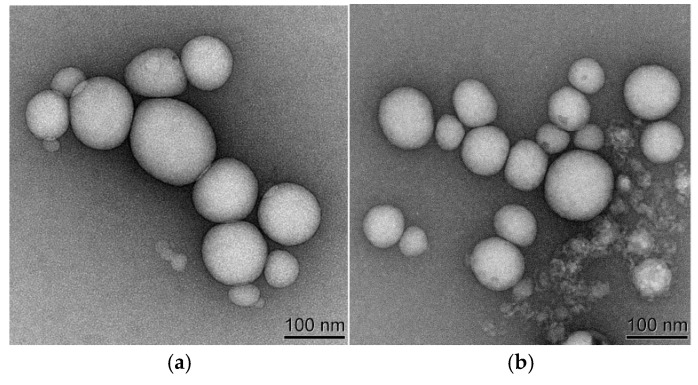
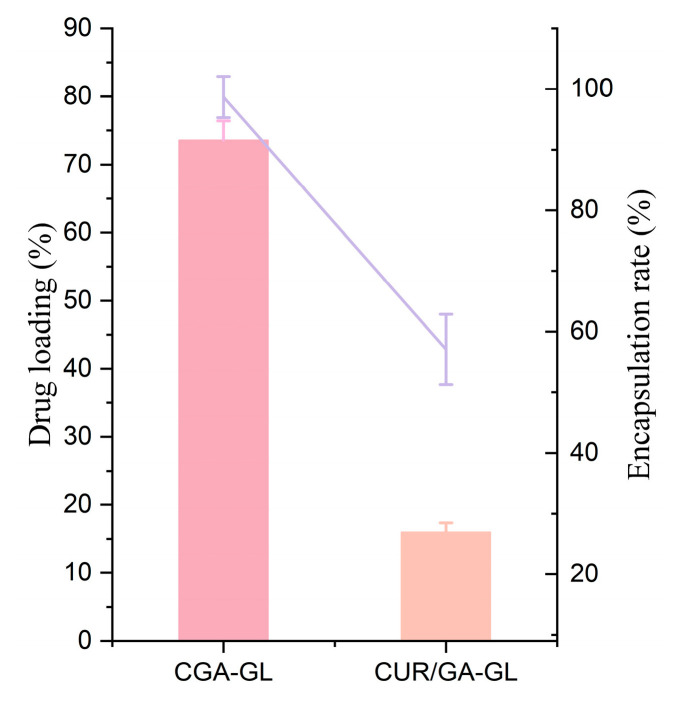
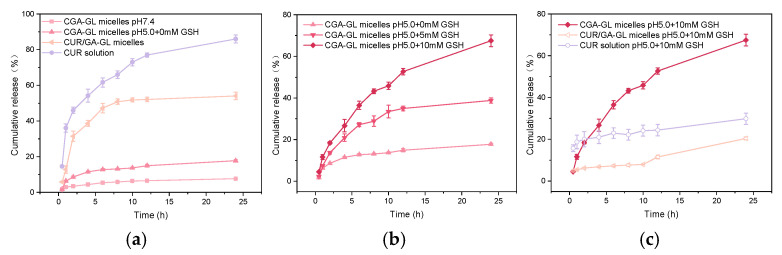
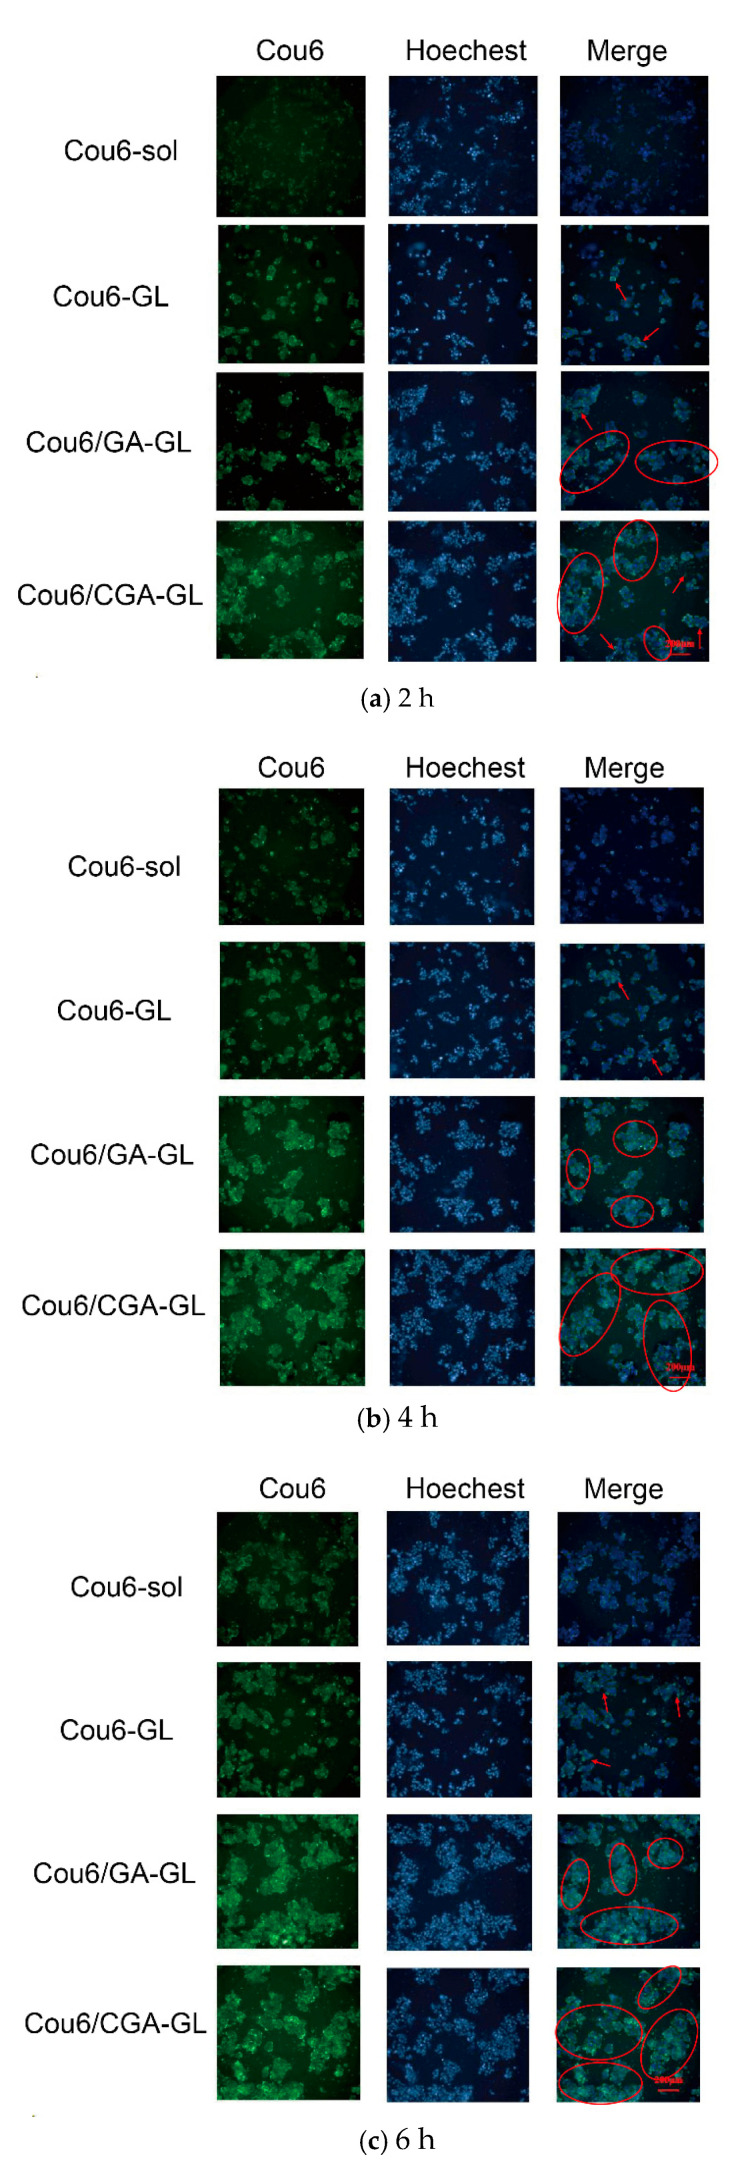
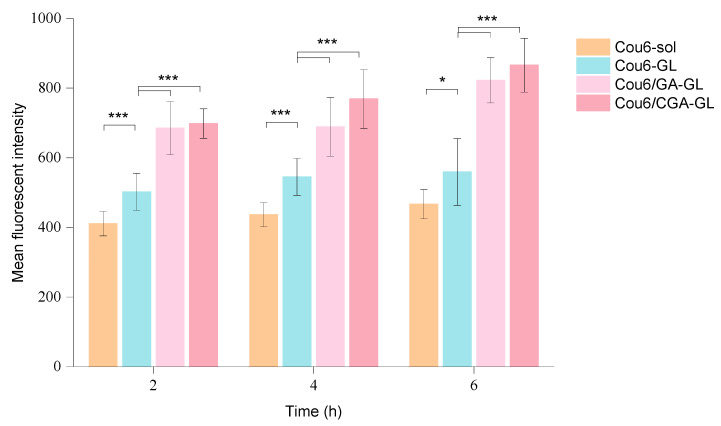
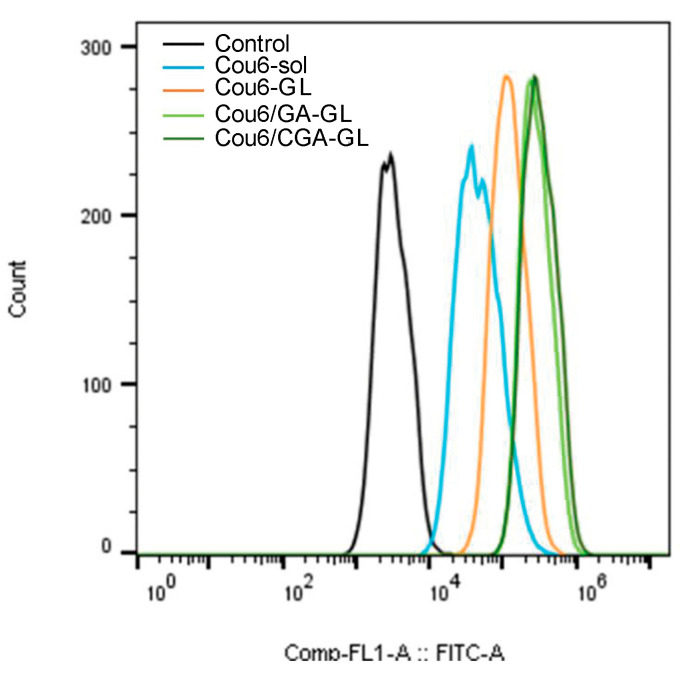
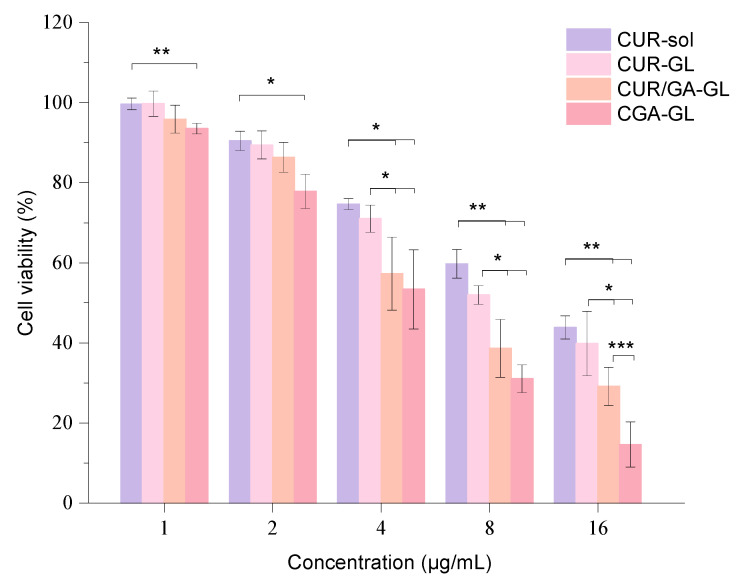
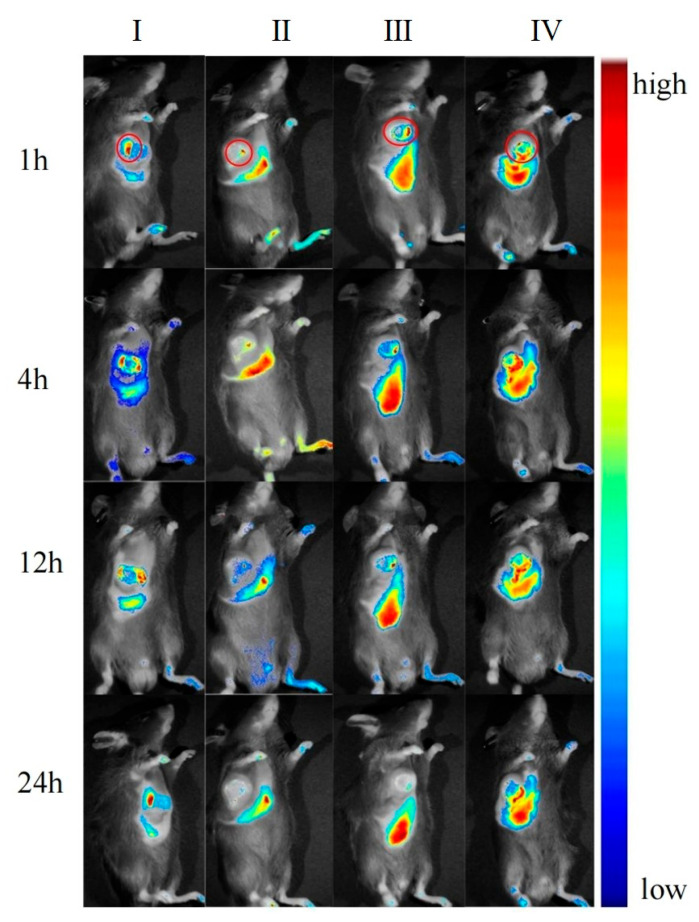
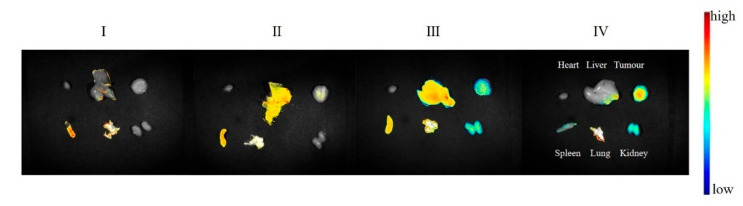
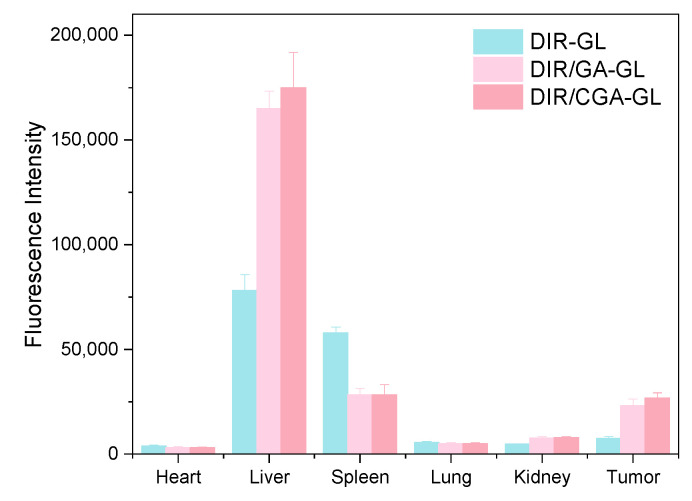
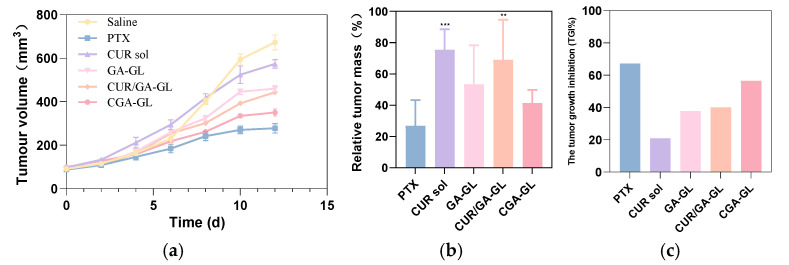
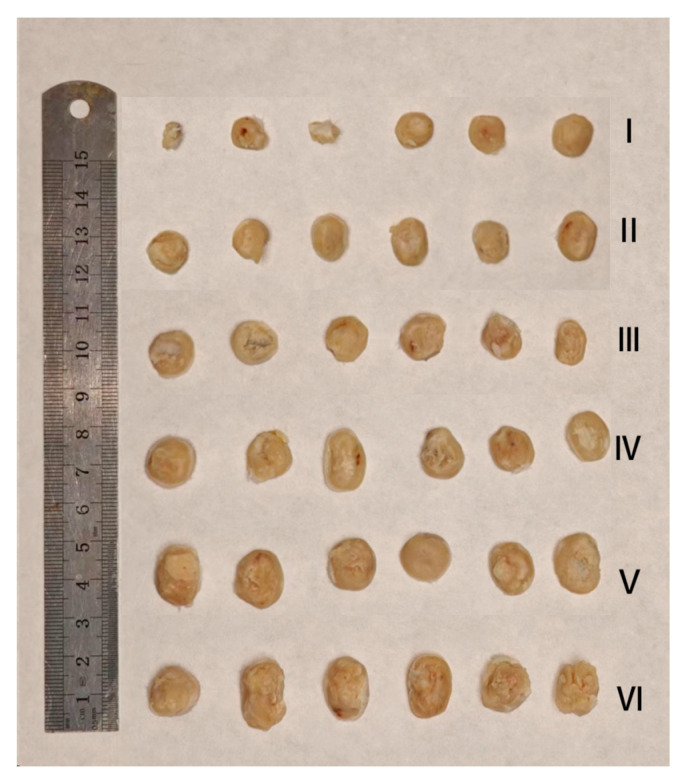
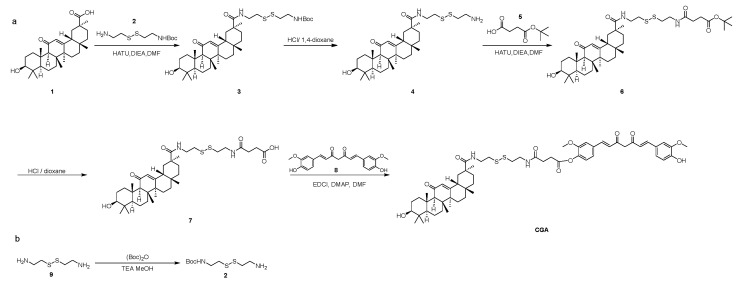
Background: Liver cancer, especially hepatocellular carcinoma, a prevalent malignant tumor of the digestive system, poses significant therapeutic challenges. While traditional chemotherapy can inhibit tumor progression, its clinical application is limited by insufficient efficacy. Hydrophobic therapeutic agents further encounter challenges including low tumor specificity, poor bioavailability, and severe systemic toxicity. This study aimed to develop a liver-targeted, glutathione (GSH)-responsive micellar system to synergistically enhance drug delivery and antitumor efficacy. Methods: A GSH-responsive disulfide bond was chemically synthesized to conjugate glycyrrhetinic acid (GA) with curcumin (Cur) at a molar ratio of 1:1, forming a prodrug Cur-GA (CGA). This prodrug was co-assembled with glycyrrhizic acid (GL) at a 300% w/w loading ratio into micelles. The system was characterized for physicochemical properties, in vitro drug release in PBS (7.4) without GSH and in PBS (5.0) with 0, 5, or 10 mM GSH, cellular uptake in HepG2 cells, and in vivo efficacy in H22 hepatoma-bearing BALB/c mice. Results: The optimized micelles exhibited a hydrodynamic diameter of 157.67 ± 2.14 nm (PDI: 0.20 ± 0.02) and spherical morphology under TEM. The concentration of CUR in micelles can reach 1.04 mg/mL. In vitro release profiles confirmed GSH-dependent drug release, with 67.5% vs. <40% cumulative Cur release observed at 24 h with/without 10 mM GSH. Flow cytometry and high-content imaging revealed 1.8-fold higher cellular uptake of CGA-GL micelles compared to free drug (p < 0.001). In vivo, CGA-GL micelles achieving 3.6-fold higher tumor accumulation than non-targeted controls (p < 0.001), leading to 58.7% tumor volume reduction (p < 0.001). Conclusions: The GA/GL-based micellar system synergistically enhanced efficacy through active targeting and stimuli-responsive release, providing a promising approach to overcome current limitations in hydrophobic drug delivery for hepatocellular carcinoma therapy.

Keywords: glycyrrhetinic acid; glycyrrhizic acid; liver cancer; micelles; target delivery.


Conflict of interest statement

The authors declare no conflicts of interest.

Figures

Figure 1
Figure 1
FTIR spectra of CUR, GA, their physical mixture (CUR + GA), and the synthesized compound CGA.
Figure 2
Figure 2
1H-NMR (600 MHz, DMSO-d6) spectrum of the synthesized compound CGA.
Figure 3
Figure 3
HPLC-UV calibration curve of CGA in methanol. The calibration equation y = 0.0858x + 1.2003 with R2 = 0.9999 indicates excellent linearity.
Figure 4
Figure 4
HPLC-UV calibration curve of CUR in methanol. The calibration equation y = 0.0545x − 0.8249 with R2 = 0.9999 indicates excellent linearity.
Figure 5
Figure 5
HPLC chromatograms of CUR, GA, CGA, and their physical mixture (mixed solution). CUR solution: main peak at 4.9 min (Orange mark); GA solution: main peak at 10.4 min (Green mark); CGA solution: main peak at 21.0 min (Pink mark); and mixed solution: peaks at 20.9 min (CGA) and peaks at 4.9 min (CUR) and 10.5 min (GA) retained. Data processing: peaks integrated with auto-threshold (n = 3, RSD% < 3%).
Figure 6
Figure 6
HPLC-MS analysis of CGA.
Figure 7
Figure 7
Characterization of micelle size, polydispersity index (PDI), and zeta potential. (a) Particle size distribution (154.76 ± 0.90 nm) and PDI (0.20 ± 0.02) of CGA-GL micelles; (b) particle size distribution (106.98 ± 0.89 nm) and PDI (0.17 ± 0.01) of CUR/GA-GL micelles; and (c) comparative zeta potential of CGA-GL micelles (−35.97 ± 0.60 mV) and CUR/GA-GL micelles (−29.47 ± 1.42 mV). Micelles dispersed in deionized water (25 °C). Data expressed as mean ± SD (n = 3).
Figure 8
Figure 8
Transmission electron microscopy (TEM) images of micelles: (a) CGA-GL micelles and (b) CUR/GA-GL micelles. (Scale bar: 100 nm).
Figure 9
Figure 9
Stability of CGA-GL micelles: particles size changes over 30 days. (Micelles in deionized water at 4 °C protected from light, n = 3).
Figure 10
Figure 10
Drug loading (histogram) and encapsulation efficiency (line chart) of CGA-GL micelles and CUR/GA-GL micelles.
Figure 11
Figure 11
In vitro drug release profiles of micelles under different conditions. (a) pH-dependent release: CUR solution, CUR/GA-GL micelles, and CGA-GL micelles at pH 7.4 vs. CGA-GL micelles at pH 5.0. (b) Redox-triggered release: CGA-GL micelles with 0, 5, or 10 mM glutathione (GSH) at pH 5.0. (c) Simulating the release conditions of tumor microenvironment (TME): CUR solution, CUR/GA-GL micelles, and CGA-GL micelles with 10 mM GSH at pH 5.0. (n = 3).
Figure 12
Figure 12
Critical micelle concentration (CMC) determination by conductivity measurements. (a) CGA-GL micelles, (b) GA-GL micelles, and (c) CUR/GA-GL micelles. (The experiment was conducted in parallel three times, and one of them was selected for plotting, mean ± SD, n = 3, RSD < 3%).
Figure 13
Figure 13
The intracellular fluorescence imaging of Cou6-loaded formulations in HepG2 cells after (a) 2 h, (b) 4 h, and (c) 6 h incubation. (Arrows: small scale cellular uptake; circles: Large scale cellular uptake; scale bar = 200 μm, n = 5).
Figure 14
Figure 14
Quantitative analysis of cellular uptake efficiency by flow cytometry. Mean fluorescence intensity (MFI) of HepG2 cells treated with Cou6-solution, Cou6-GL micelles, Cou6/GA-GL micelles, and Cou6/CGA-GL micelles at 2, 4, and 6 h (n = 5). (* p < 0.05 and *** p < 0.001).
Figure 15
Figure 15
Flow cytometry histograms of cellular uptake efficiency in HepG2 cells.
Figure 16
Figure 16
Concentration-dependent cytotoxicity of CUR formulations in HepG2 cells. (R2 > 0.95, n = 5, * p < 0.05, ** p < 0.01, and *** p < 0.001).
Figure 17
Figure 17
Real-time in vivo fluorescence imaging of DIR-labeled preparations (I: DIR solution group; II: DIR-GL micelles group; III: DIR/GA-GL micelles group; and IV: DIR/CGA-GL micelles group) within 24 h. (Circles: tumor site; n = 3).
Figure 18
Figure 18
Ex vivo fluorescence imaging of major organs at 24 h post-injection (I: DIR solution group; II: DIR-GL micelles group; III: DIR/GA-GL micelles group; and IV: DIR/CGA-GL micelles group).
Figure 19
Figure 19
Ex vivo fluorescence intensity of DIR-labeled micelles in major organs and tumors at 24 h post-injection (n = 3).
Figure 20
Figure 20
In vivo antitumor efficacy of BALB/c mice bearing H22 tumor cells. (a) Tumor volume kinetics over 12 days. (b) Relative tumor mass at endpoint (Day 12). (c) Tumor growth inhibition rate (TGI%). (n = 6, ** p < 0.01, and *** p < 0.001).
Figure 21
Figure 21
Tumor images and therapeutic efficacy validation after 12-day treatment. (I: PTX group; II: CGA-GL micelles group; III: GA-GL micelles group; IV: CUR/GA-GL micelles group; V: CUR sol; and VI: saline; n = 6).
Figure 22
Figure 22
TUNEL assay evaluating H22 hepatoma cell apoptosis in tumor tissues. (I: saline; II: CUR solution group; III: GA-GL micelles group; IV: CUR/GA-GL micelles group; V: CGA-GL micelles group; and VI: PTX solution group. Arrows: red-positive nuclei; Scale bar: 100 μm).
Figure 23
Figure 23
Body weight dynamics of H22 hepatoma-bearing mice during 12-day treatment (n = 6).
Figure 24
Figure 24
Histopathological analysis of major organs by H&E staining. (I: saline; II: PTX solution; III: CUR solution; IV: GA-GL micelles; V: CUR/GA-GL micelles; and VI: CGA-GL micelles. Scale bar: 100 μm).
Figure 25
Figure 25
Serum biochemical indices for hepatotoxicity and nephrotoxicity evaluation. (a) Aspartate aminotransferase (AST) analysis results. (b) Alanine aminotransferase (ALT) analysis results. (c) Creatinine (CRE) analysis results. (n = 6, ** p < 0.01, and *** p < 0.001).
Figure 26
Figure 26
Synthesis route of (a) CUR-GA and (b) Compound 2.

Similar articles

References

    1. Devarbhavi H.C., Asrani S.K., Arab J.P., Nartey Y.A., Pose E., Kamath P.S. Global burden of Liver Disease: 2023 Update. J. Hepatol. 2023;79:516–537. - PubMed
    1. Huang D.Q., Singal A.G., Kono Y., Tan D.J.H., El-Serag H.B., Loomba R. Changing global epidemiology of liver cancer from 2010 to 2019: NASH is the fastest growing cause of liver cancer. Cell Metab. 2022;34:969–977.e962. doi: 10.1016/j.cmet.2022.05.003. - DOI - PMC - PubMed
    1. Shi X., Wang X., Yao W., Shi D., Shao X., Lu Z., Chai Y., Song J., Tang W., Wang X. Mechanism insights and therapeutic intervention of tumor metastasis: Latest developments and perspectives. Signal Transduct. Target. Ther. 2024;9:192. doi: 10.1038/s41392-024-01885-2. - DOI - PMC - PubMed
    1. Diao X., Guo C., Jin Y., Li B., Gao X., Du X., Chen Z., Jo M., Zeng Y., Ding C., et al. Cancer situation in China: An analysis based on the global epidemiological data released in 2024. Cancer Commun. 2025;45:178–197. doi: 10.1002/cac2.12627. - DOI - PMC - PubMed
    1. Cao M., Ding C., Xia C., Li H., Sun D., He S., Chen W. Attributable deaths of liver cancer in China. Chin. J. Cancer Res. 2021;33:480–489. doi: 10.21147/j.issn.1000-9604.2021.04.05. - DOI - PMC - PubMed

LinkOut - more resources