Review
. 2025 Mar 25;18(4):459.
doi: 10.3390/ph18040459.

Hypoxia Imaging in Lung Cancer: A PET-Based Narrative Review for Clinicians and Researchers

Affiliations
Review

Hypoxia Imaging in Lung Cancer: A PET-Based Narrative Review for Clinicians and Researchers

Ahmad Alenezi et al. Pharmaceuticals (Basel). .

Abstract

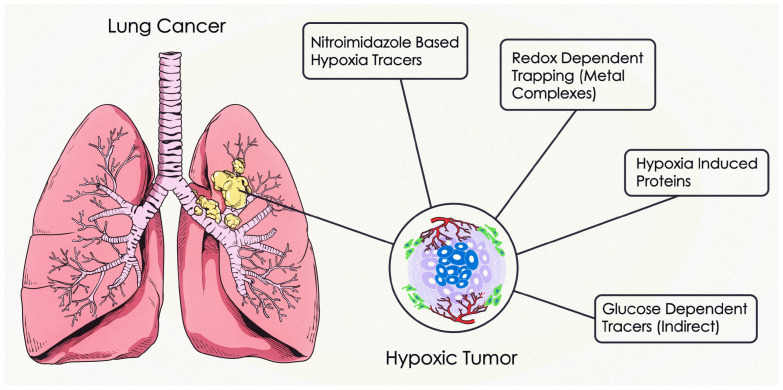
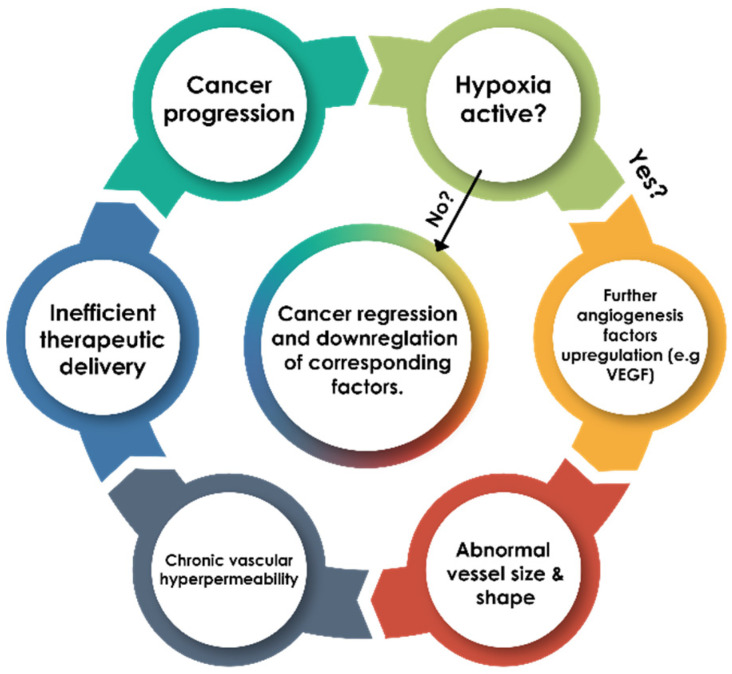
Background: Hypoxia plays a critical role in lung cancer progression and treatment resistance by contributing to aggressive tumor behavior and poor therapeutic response. Molecular imaging, particularly positron emission tomography (PET), has become an essential tool for noninvasive hypoxia detection, providing valuable insights into tumor biology and aiding in personalized treatment strategies. Objective: This narrative review explores recent advancements in PET imaging for detecting hypoxia in lung cancer, with a focus on the development, characteristics, and clinical applications of various radiotracers. Findings: Numerous PET-based hypoxia radiotracers have been investigated, each with distinct pharmacokinetics and imaging capabilities. Established tracers such as 18F-Fluoromisonidazole (18F-FMISO) remain widely used, while newer alternatives like 18F-Fluoroazomycin Arabinoside (18F-FAZA) and 18F-Flortanidazole (18F-HX4) demonstrate improved clearance and image contrast. Additionally, 64Cu-ATSM has gained attention for its rapid tumor uptake and hypoxia selectivity. The integration of PET with hybrid imaging modalities, such as PET/CT and PET/MRI, enhances the spatial resolution and functional interpretation, making hypoxia imaging a promising approach for guiding radiotherapy, chemotherapy, and targeted therapies. Conclusions: PET imaging of hypoxia offers significant potential in lung cancer diagnosis, treatment planning, and therapeutic response assessment. However, challenges remain, including tracer specificity, quantification variability, and standardization of imaging protocols. Future research should focus on developing next-generation radiotracers with enhanced specificity, optimizing imaging methodologies, and leveraging multimodal approaches to improve clinical utility and patient outcomes.

Keywords: cancer; emission; hypoxia; positron; tomography.


Conflict of interest statement

The authors declare no conflicts of interest.

Figures

Figure 5
Figure 5
Representative PET imaging results comparing [18F]-FMISO, [18F]-FDG, and [18F]-FAZA in a lung cancer patient. Coronal, axial fused, and axial PET images demonstrate tracer uptake in the tumor, highlighting differences in hypoxia ([18F]-FMISO and [18F]-FAZA) and glucose metabolism ([18F]-FDG). The images show the distinct localization of each tracer, emphasizing the role of hypoxia imaging ([18F]-FMISO and [18F]-FAZA) versus metabolic imaging ([18F]-FDG) in tumor characterization This figure is reproduced from Thureau et al., 2021 under a CC BY 4.0 license (DOI: 10.3390/cancers13164101) [69]. No additional permission is required.
Figure 9
Figure 9
Transaxial PET images of 62Cu-ATSM (A), 18F-FDG (B), their fused overlay (C), and the corresponding CT scan (D) of a 59-year-old male with SCC in the right hilus. The fusion image displays 62Cu-ATSM PET in color and 18F-FDG PET in grayscale. Reproduced from Lohith et al., 2009 under a CC BY license (DOI: 10.2967/jnumed.109.069021) [152].
Figure 1
Figure 1
Lung cancer can be detected via biomolecular processes used in lung cancer hypoxia imaging.
Figure 2
Figure 2
The mean (approximate) oxygen levels in various tissues (pressure in mmHg and oxygen as a percentage). The information included in this figure was derived from several articles [35,36,37]. 1: Includes human and animal studies. 2: Pressure and percentage of oxygen may vary as they are subject to change due their proximity to major organs. 3: Represent disruption to normal homeostasis at or below which a hypoxic catastrophic cascade of the event may initiate (as shown in Figure 3). 4: At this point, the radiotoxic effect is at half maximal. Also, the hypoxia cutoff is different for different radiotracers.
Figure 3
Figure 3
Illustration of the cascade of events leading to cancer progression during therapeutic interventions. The author assumes hypoxia as a starting point of this catastrophic cascade of illness.
Figure 4
Figure 4
Nitroimidazoles reaction inside hypoxic cells (mechanism of trapping). During the hypoxic conditions, the reactive species (R-NHOH) predominantly form covenant (σ) bonds with intracellular macromolecules and are trapped inside the hypoxic cell.
Figure 6
Figure 6
Uptake of 18F-FETNIM (A) in a squamous carcinoma patient and 18F-FMISO (B) in a small cell lung cancer patient at 2 h post-injection. The arrows indicate the tumor’s location. Reproduced from Wei et al., 2016 under a CC BY license (DOI: 10.1371/journal.pone.0157606) [73].
Figure 7
Figure 7
Subject demonstrated positive 18F-FSPG uptake (FSBG+) (SUVmax 2.02) and negative 18F-FDG uptake (FDG−) (SUVmax 0.7) in PET/CT imaging. Reproduced from Paez et al., 2022 under a CC BY license (DOI: 10.1371/journal.pone.0265427) [91].
Figure 8
Figure 8
Illustration of voxel-wise analysis in lung cancer patients (patients 1 and 4), showing the axial plane of CT scans with gross tumor volumes outlined in yellow alongside the first and second registered [18F]HX4 PET scans and a difference map highlighting variations between the two scans. Reproduced from Zegers et al., 2015 under a CC BY license (DOI: 10.1007/s00259-015-3100-z) [138].
Figure 10
Figure 10
Steps for radiotracer feasibility studies.
Figure 11
Figure 11
Effect of reconstruction on SUVmax and lesion volume (liver lesion, arrow). (A) 2 × 8 OSEM, 128 × 128 matrix, 8-mm filter: ~11-mm resolution, 4.5 mL lesion. (B) 4 × 16 OSEM, 256 × 256 matrix, 5-mm filter: ~7-mm resolution, 1.5 mL lesion. (Image from [198]).

Similar articles

References

    1. National Cancer Institute Lung and Bronchus Cancer; Cancer Stat Facts. [(accessed on 14 April 2024)]; Available online: https://seer.cancer.gov/statfacts/html/lungb.html.
    1. Nicholson A.G., Tsao M.S., Beasley M.B., Borczuk A.C., Brambilla E., Cooper W.A., Dacic S., Jain D., Kerr K.M., Lantuejoul S., et al. The 2021 WHO classification of lung tumors: Impact of advances since 2015. J. Thorac. Oncol. 2022;17:362–387. doi: 10.1016/j.jtho.2021.11.003. - DOI - PubMed
    1. Ekinci M., Magne T.M., Alencar L.M.R., Fechine P.B.A., Santos-Oliveira R., Ilem-Özdemir D. Molecular imaging for lung cancer: Exploring small molecules, peptides, and beyond in radiolabeled diagnostics. Pharmaceutics. 2024;16:404. doi: 10.3390/pharmaceutics16030404. - DOI - PMC - PubMed
    1. Oprea-Lager D.E., MacLennan S., Bjartell A., Briganti A., Burger I.A., de Jong I., De Santis M., Eberlein U., Emmett L., Fizazi K., et al. European association of nuclear medicine focus 5: Consensus on molecular imaging and theranostics in prostate cancer. Eur. Urol. 2024;85:49–60. doi: 10.1016/j.eururo.2023.09.003. - DOI - PubMed
    1. Hanahan D. Hallmarks of cancer: New dimensions. Cancer Discov. 2022;12:31–46. doi: 10.1158/2159-8290.CD-21-1059. - DOI - PubMed

LinkOut - more resources