. 2025 Mar 26;18(4):468.
doi: 10.3390/ph18040468.

Aromatic Molecular Compatibility Attenuates Influenza Virus-Induced Acute Lung Injury via the Lung-Gut Axis and Lipid Droplet Modulation

Affiliations

Aromatic Molecular Compatibility Attenuates Influenza Virus-Induced Acute Lung Injury via the Lung-Gut Axis and Lipid Droplet Modulation

Yi Li et al. Pharmaceuticals (Basel). .

Abstract

Background: Acute lung injury (ALI) is a major cause of death in patients with various viral pneumonias. Our team previously identified four volatile compounds from aromatic Chinese medicines. Based on molecular compatibility theory, we defined their combination as aromatic molecular compatibility (AC), though its therapeutic effects and underlying mechanisms remain unclear. Methods: This study used influenza A virus (IAV) A/PR/8/34 to construct cell and mouse models of ALI to explore AC's protective effects against viral infection. The therapeutic effect of AC was verified by evaluating the antiviral efficacy in the mouse models, including improvements in their lung and colon inflammation, oxidative stress, and the suppression of the NLRP3 inflammasome. In addition, 16S rDNA and lipid metabolomics were used to analyze the potential therapeutic mechanisms of AC. Results: Our in vitro and in vivo studies demonstrated that AC increased the survival of the IAV-infected cells and mice, inhibited influenza virus replication and the expression of proinflammatory factors in the lung tissues, and ameliorated barrier damage in the colonic tissues. In addition, AC inhibited the expression of ROS and the NLRP3 inflammasome and improved the inflammatory cell infiltration into the lung tissues. Finally, AC effectively regulated intestinal flora disorders and lipid metabolism in the model mice, significantly reduced cholesterol and triglyceride expression, and thus reduced the abnormal accumulation of lipid droplets (LDs) after IAV infection. Conclusions: In this study, we demonstrated that AC could treat IAV-induced ALIs through multiple pathways, including antiviral and anti-inflammatory pathways and modulation of the intestinal flora and the accumulation of LDs.

Keywords: NLRP3 inflammasome; acute lung injury; influenza A virus; lipid droplets; molecular compatibility; volatile compounds.


Conflict of interest statement

Author Zhongpeng Zhao was employed by Beijing Minhai Biotechnology Co., Ltd. The remaining authors declare that the research was conducted in the absence of any commercial or financial relationships that could be construed as a potential conflict of interest.

Figures

Figure 1
Figure 1
In vitro safety and antiviral activity. (AF) Dose–response curves for half-maximal inhibitory concentration (IC50), half-maximal cytotoxic concentration (CC50), and selectivity index (SI) of patchouli alcohol, carvacrol, p-cymene, eucalyptol, AC, and oseltamivir against IAV. The cytotoxicity of six drug groups against the MDCK and A549 cells was determined using a CCK8 assay (n = 3).
Figure 2
Figure 2
AC protects mice infected with influenza virus. (A) Scheme of once-daily dosing for 14 consecutive days after infecting mice with the 103TCID50 IAV PR8 strain via nose drops (n = 10). (B) Survival rates (expressed as percentages) of IAV-challenged mice through treatment with oseltamivir and AC (n = 10). (C) Scheme of once-daily dosing for 4 consecutive days after using nose drops infected with the 103TCID50 IAV PR8 strain in mice (n = 10). (D) Effect of treatment with oseltamivir and AC on the recovery of body weight in IAV-infected mice (n = 10). (E) Reduction in IAV genome copy number in lungs sampled from IAV-challenged mice through treatment with AC (n = 8). (F,G) Lung index and lung index inhibition in H1N1 mice after AC treatment (n = 6). The data are presented as the mean ± SD, * p < 0.05, ** p < 0.01, *** p < 0.001, ns: not significant.
Figure 3
Figure 3
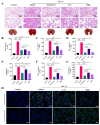
AC attenuates IAV-induced pulmonary inflammation in mice with ALIs. (A) Representative images showing histopathological changes in the lung tissues and their amelioration following the AC treatment (upper panel scale bar = 200 μm, lower panel scale bar = 50 μm, n = 3). (BG) The expression of TNF-α, IL-6, INF-γ, IP-6, MCP-1, and CCL3 in the pulmonary tissue was evaluated in each group (n = 6). (H) Lung tissue F4/80 (red) and iNOS (green) expression and lung tissue F4/80 (red) and CD206 (green) expression after AC treatment of the IAV-infected mice (scale bar = 20 μm, n = 3). The data are presented as the mean ± SD, * p < 0.05, ** p < 0.01, *** p < 0.001, ns: not significant.
Figure 4
Figure 4
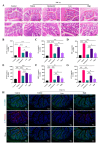
AC attenuates IAV-induced colonic lesions in mice with ALIs. (A) Representative images of colonic histologic lesions. Improvement in colonic histologic lesions through AC therapy (upper panel scale bar = 100 μm, lower panel scale bar = 50 μm, n = 3). (BG) The expression of TNF-α, IL-6, INF-γ, IP-6, MCP-1, and CCL3 in the colon tissue was evaluated in each group (n = 6). (H) Expression of ZO-1 (green) and occludin (red) in colonic tissues of mice with IAV-induced ALIs after AC treatment (scale bar = 100 μm, n = 3). The data are presented as the mean ± SD, * p < 0.05, ** p < 0.01, *** p < 0.001, **** p < 0.0001, ns: not significant.
Figure 5
Figure 5
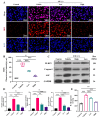
AC inhibits ROS and the NLRP3 inflammasome in mice with IAV-induced ALIs. (A,B) AC inhibits ROS expression (scale bar = 20 μm) and fluorescence quantification (n = 4) in the lung tissues of mice with IAV-induced ALIs. (C,D) Lung tissue WB bands and relative protein expression of NLRP3/ASC/caspase-1-related proteins (n = 3). (E) IL-1β expressions in the lungs (n = 8). The data are presented as the mean ± SD, * p < 0.05, ** p < 0.01, *** p < 0.001, ns: not significant.
Figure 6
Figure 6
AC suppresses immune cell infiltration in mice with IAV-induced ALIs. (A) Effect of AC on T-lymphocytes in peripheral blood of mice with IAV-induced ALIs (The green box represents the proportion of CD3+ T cells, n = 3). (BD) The CD8+ T cells, CD4+ T cells, and CD4+/CD8+ ratio in the peripheral blood undergo alterations following the AC treatment (n = 3). (E) The regulation of AC on the expression of CD4+, CD8+, and CD68+ in the lung tissues of mice with IAV-induced ALIs (scale bar = 100 μm, n = 3). (FH) The expression levels of CD8+, CD4+, and CD68+ in the lung tissue following the AC treatment were evaluated (n = 3). The data are presented as the mean ± SD, * p < 0.05, ** p < 0.01, *** p < 0.001, ns: not significant.
Figure 7
Figure 7
AC’s modulation of the gut microbiota in mice with IAV-induced ALIs and analysis of species differences. (A) α-diversity analysis (n = 6) and (B) PCA, PCoA of the weighted unifrac, and NMDS analysis based on the Bray–Curtis distance algorithm for the control, vehicle, and high-dose AC treatment groups (n = 9). (C) Differences in the gut microbiota at the phylum level. (D) The ratio of Firmicutes/Bacteroidetes (F/B) in the three groups of mice (n = 6). (E) The relative abundance of the differential microbiomes between the control and vehicle groups at the genus level was found to be significantly regulated by AC. (F) Inhibitory effect of AC on conditionally pathogenic intestinal bacteria after IAV infection (n = 6). (G) Effect of AC on intestinal probiotics after IAV infection (n = 6). (H) Functional enrichment of differential flora at the pathway level. The data are presented as the mean ± SD, * p < 0.05, ** p < 0.01, *** p < 0.001, **** p < 0.0001, ns: not significant.
Figure 8
Figure 8
Lipid metabolism analysis of the effect of AC on sera from mice with IAV-induced ALIs. (A) PCA and PLS-DA (B,C) score plots of the serum lipid metabolite profiles between the different groups. Volcano plots of differential metabolites between (D) control and vehicle groups and (E) high-dose and vehicle groups, where red represents upregulated significantly differentially expressed metabolites, blue represents downregulated significantly differentially expressed metabolites, and gray dots represent non-significantly differentially expressed metabolites. (F) Heat map of differential metabolites between the control and vehicle and AC (high-dose) and vehicle groups. (G) KEGG enrichment analysis, (H) enrichment scatter plot, and KEGG-enriched ES fold plot (I) showed the changes in the lipid metabolic process in the serum after the AC treatment (Red represents genes enriched in the AC treatment group, and green represents genes enriched in the model group). The data are presented as the mean ± SD, n = 6.
Figure 9
Figure 9
AC suppressed the abnormal IAV-induced accumulation of LDs. (A,B) The effect of AC on the accumulation of LDs. (C) Cholesterol and (D) TG levels in the MDCK and A549 cells after IAV infection. (E,F) The effect of AC on the accumulation of LDs and (G) cholesterol and (H) TG levels in the lung tissue of mice with IAV-induced ALIs. The data are presented as the mean ± SD, n = 4. * p < 0.05, ** p < 0.01, *** p < 0.001, ns: not significant.
Figure 10
Figure 10
Aromatic molecular compatibility (AC) obtained using four known active compounds obtained from aromatic Chinese medicines by applying the theory of Chinese medicine and molecular compatibility. The protective effects of AC on mice with IAV-induced ALIs were illustrated based on multiple pathways, including antiviral and anti-inflammatory pathways and the modulation of the lung–intestinal axis and lipid droplet metabolism.

Similar articles

References

    1. Graham B.S., Sullivan N.J. Emerging viral diseases from a vaccinology perspective: Preparing for the next pandemic. Nat. Immunol. 2018;19:20–28. doi: 10.1038/s41590-017-0007-9. - DOI - PMC - PubMed
    1. Nowak M.D., Sordillo E.M., Gitman M.R., Paniz Mondolfi A.E. Coinfection in SARS-CoV-2 infected patients: Where are influenza virus and rhinovirus/enterovirus? J. Med. Virol. 2020;92:1699–1700. doi: 10.1002/jmv.25953. - DOI - PMC - PubMed
    1. Bao L., Deng W., Qi F., Lv Q., Song Z., Liu J., Gao H., Wei Q., Yu P., Xu Y., et al. Sequential infection with H1N1 and SARS-CoV-2 aggravated COVID-19 pathogenesis in a mammalian model, and co-vaccination as an effective method of prevention of COVID-19 and influenza. Signal Transduct. Target. Ther. 2021;6:200. doi: 10.1038/s41392-021-00618-z. - DOI - PMC - PubMed
    1. Yue H., Zhang M., Xing L., Wang K., Rao X., Liu H., Tian J., Zhou P., Deng Y., Shang J. The epidemiology and clinical characteristics of co-infection of SARS-CoV-2 and influenza viruses in patients during COVID-19 outbreak. J. Med. Virol. 2020;92:2870–2873. doi: 10.1002/jmv.26163. - DOI - PMC - PubMed
    1. Huang Q., Wu X., Zheng X., Luo S., Xu S., Weng J. Targeting inflammation and cytokine storm in COVID-19. Pharmacol. Res. 2020;159:105051. doi: 10.1016/j.phrs.2020.105051. - DOI - PMC - PubMed

LinkOut - more resources