. 2025 Mar 28;18(4):491.
doi: 10.3390/ph18040491.

Endoplasmic Reticulum-Targeted Phototherapy Remodels the Tumor Immunopeptidome to Enhance Immunogenic Cell Death and Adaptive Anti-Tumor Immunity

Affiliations

Endoplasmic Reticulum-Targeted Phototherapy Remodels the Tumor Immunopeptidome to Enhance Immunogenic Cell Death and Adaptive Anti-Tumor Immunity

Weidong Xiao et al. Pharmaceuticals (Basel). .

Abstract

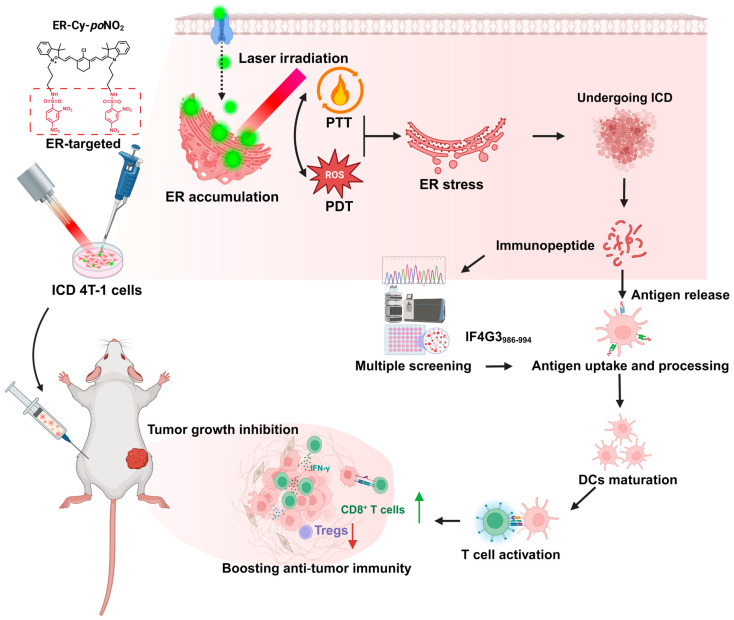
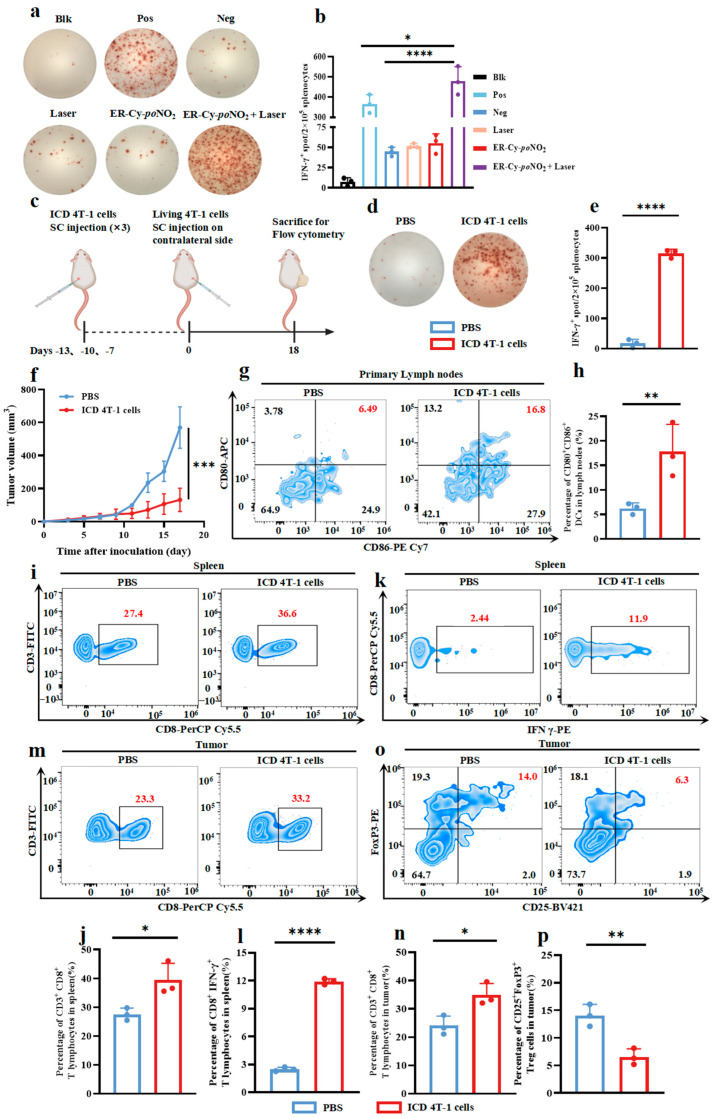
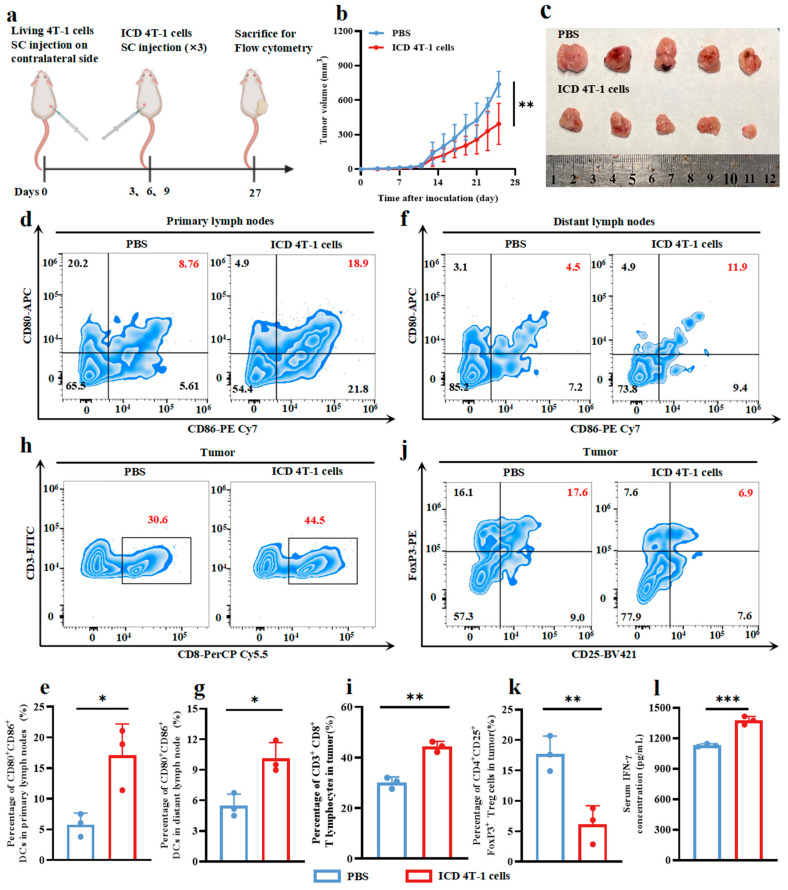
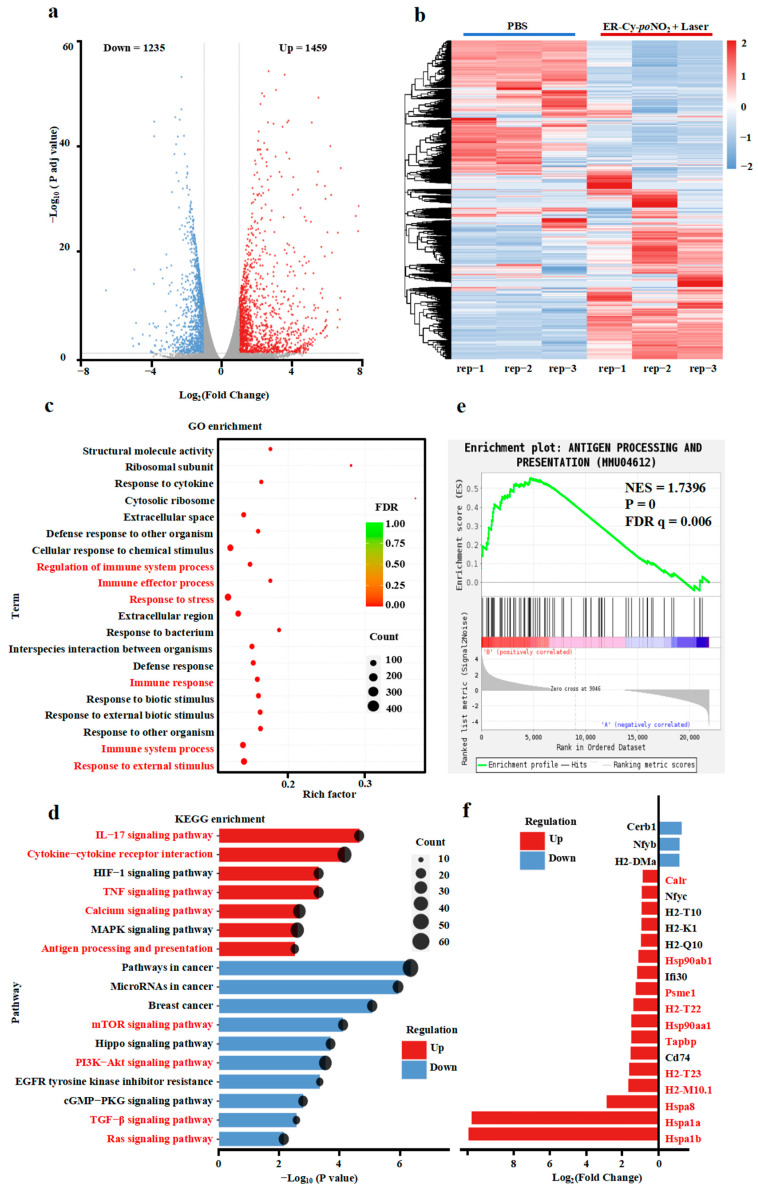
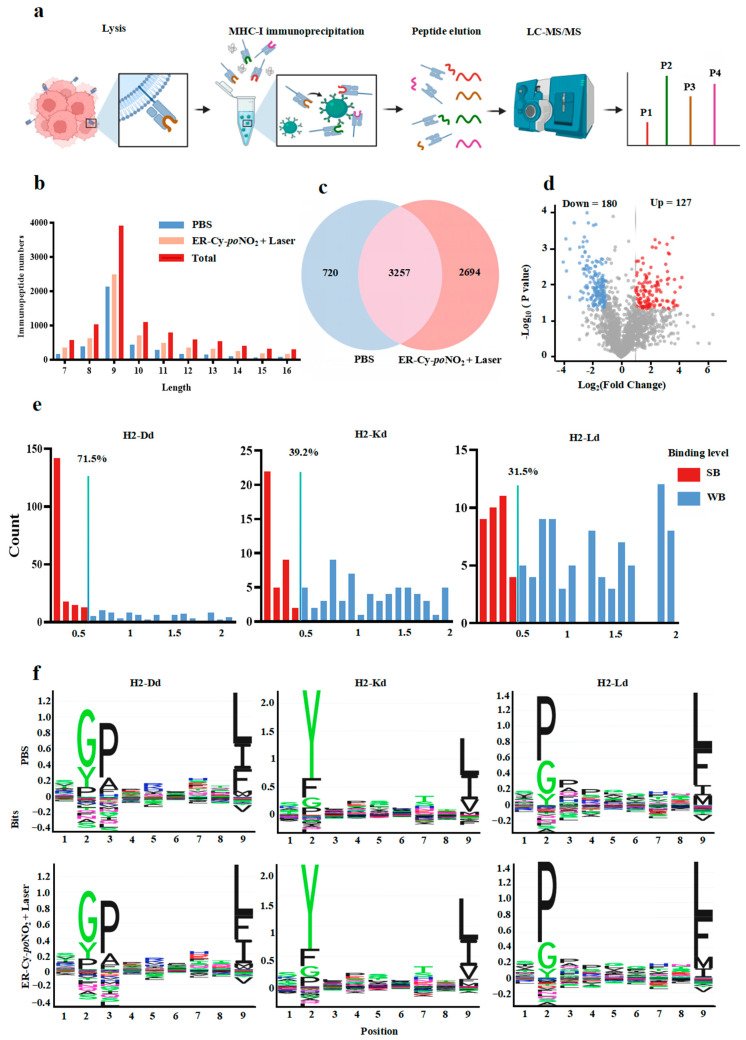
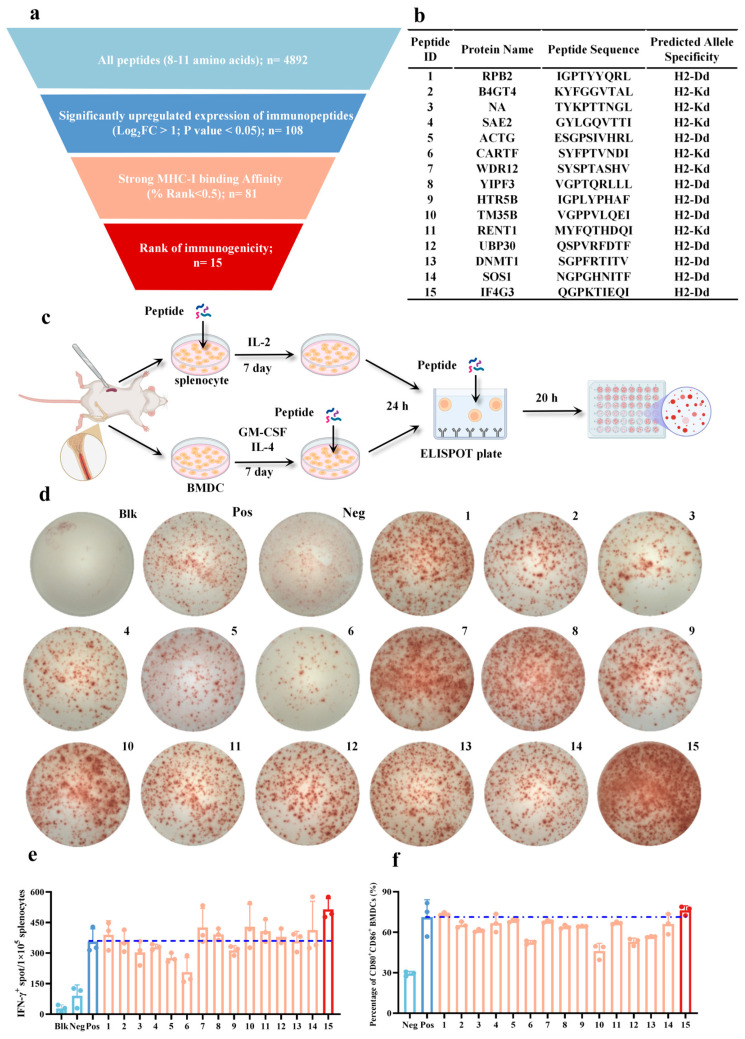
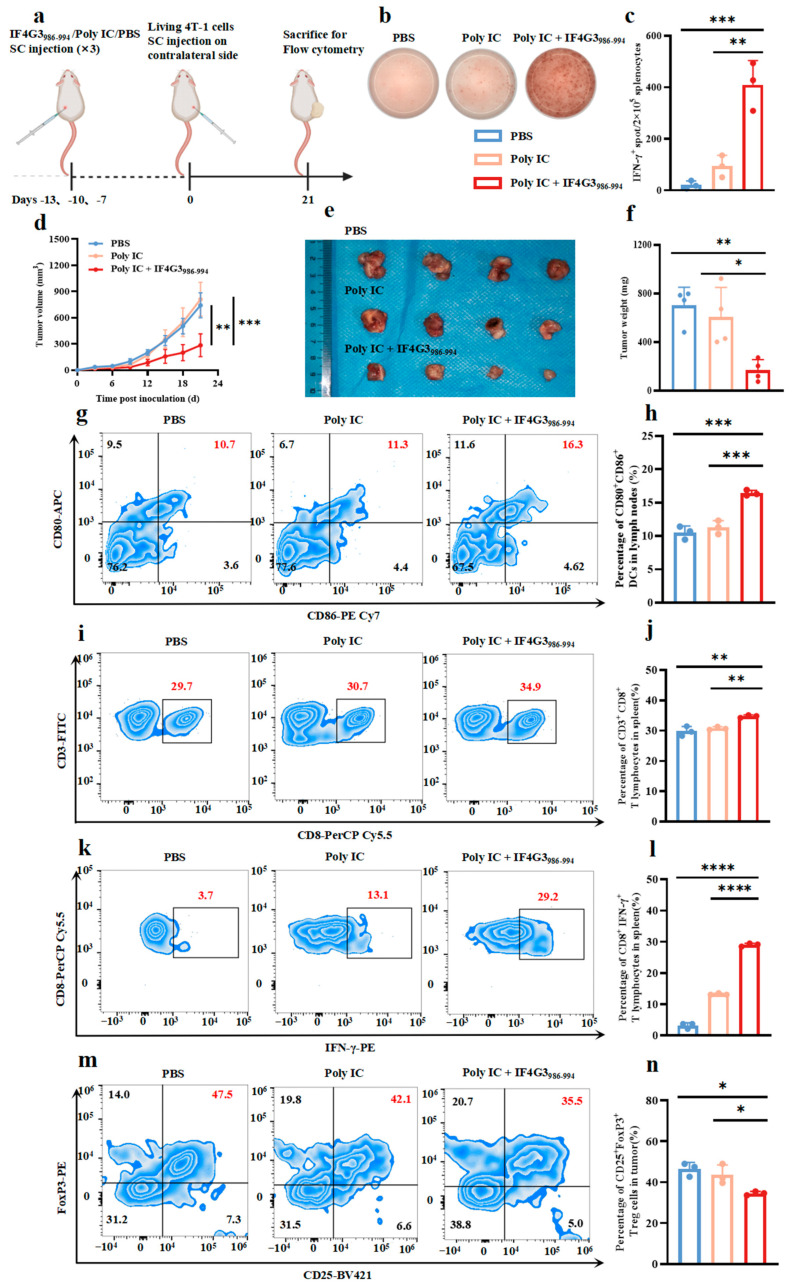
Background: Endoplasmic reticulum (ER)-targeted phototherapy has emerged as a promising approach to amplify ER stress, induce immunogenic cell death (ICD), and enhance anti-tumor immunity. However, its impact on the antigenicity of dying tumor cells remains poorly understood. Methods: Laser activation of the ER-targeted photosensitizer ER-Cy-poNO2 was performed to investigate its effects on tumor cell antigenicity. Transcriptomic analysis was carried out to assess gene expression changes. Immunopeptidomics profiling was used to identify high-affinity major histocompatibility complex class I (MHC-I) ligands. In vitro functional studies were conducted to evaluate dendritic cell maturation and T lymphocyte activation, while in vivo experiments were performed by combining the identified peptide with poly IC to evaluate anti-tumor immunity. Results: Laser activation of ER-Cy-poNO2 significantly remodeled the antigenic landscape of 4T-1 tumor cells, enhancing their immunogenicity. Transcriptomic analysis revealed upregulation of antigen processing and presentation pathways. Immunopeptidomics profiling identified multiple high-affinity MHC-I ligands, with IF4G3986-994 (QGPKTIEQI) showing exceptional immunogenicity. In vitro, IF4G3986-994 promoted dendritic cell maturation and enhanced T lymphocytes activation. In vivo, the combination of IF4G3986-994 with poly IC elicited robust anti-tumor immunity, characterized by increased CD8+ T lymphocytes infiltration, reduced regulatory T cells (Tregs) in the tumor microenvironment, elevated systemic Interferon-gamma (IFN-γ) levels, and significant tumor growth inhibition without systemic toxicity. Conclusions: These findings establish a mechanistic link between ER stress-driven ICD, immunopeptidome remodeling, and adaptive immune activation, highlighting the potential of ER-targeted phototherapy as a platform for identifying immunogenic peptides and advancing peptide-based cancer vaccines.

Keywords: ER-targeted phototherapy; adaptive anti-tumor immunity; endoplasmic reticulum stress; immunogenic cell death; immunogenic peptides; tumor immunopeptidome remodeling.


Conflict of interest statement

The authors declare no conflicts of interest.

Figures

Figure 1
Figure 1
A schematic depiction of the underlying mechanism by which ER-targeted phototherapy remodels the tumor immunopeptidome to enhance immunogenic cell death and adaptive anti-tumor immunity. The photo-triggered immunotherapy is achieved by a tumor-ER dual-targeted photosensitizer (ER-Cy-poNO2) which can robustly induce the ER stress-driven ICD of tumor cells (ICD 4T-1 cells in this work). Consequently, substantial tumor-derived MHC-I binding peptides are produced. After multiple screenings of these peptides, IF4G3986–994 (QGPKTIEQI) is identified with an exceptional immunogenicity which enables it to effectively augment the anti-tumor immunity. The figure was created in BioRender. Gao, M. (2025) https://BioRender.com/p39u912, accessed on 19 February 2025.
Figure 2
Figure 2
ER-targeted phototherapy enhanced the immunogenicity of 4T-1 tumor cells undergoing ICD. (a) Representative ELISPOT images showing IFN-γ spots after co-incubation of 4T-1 cells with splenocytes under different treatments. (b) Summary data for the assay in (a) showing the mean IFN-γ spot number per 2 × 10⁵ splenocytes ± s.d. in duplicate cultures. (n = 3, mean ± s.d.). (c) The workflow for the tumor vaccination experiment. (d) Representative ELISPOT images showing IFN-γ spots of splenocytes from mice inoculated with 4T-1 cells subjected to different treatments. (e) Summary data for the assay in (d) showing the mean IFN-γ spot number per 2 × 10⁵ splenocytes ± s.d. in duplicate cultures. (n = 3, mean ± s.d.). (f) Tumor volume curves during the observation period (n = 5, mean ± s.d.). (g) Representative images of flow cytometry analysis of DC maturation (CD80+CD86+) in primary lymph nodes. (h) Quantitative analysis of the proportion of CD80+CD86+ DCs in (g) (n = 3, mean ± s.d.). (i) Representative images of flow cytometry analysis of T lymphocytes (CD3+CD8+) in spleen. (j) Quantitative analysis of the proportion of CD3+CD8+ T lymphocytes in (i) (n = 3, mean ± s.d.). (k) Representative images of flow cytometry analysis of T lymphocytes (CD8+IFN-γ+) in spleen. (l) Quantitative analysis of the proportion of CD8+IFN-γ+ T lymphocytes in (k) (n = 3, mean ± s.d.). (m) Representative images of flow cytometry analysis of T lymphocytes (CD3+CD8+) in the tumor. (n) Quantitative analysis of the proportion of CD3+CD8+ T lymphocytes in (m) (n = 3, mean ± s.d.). (o) Representative images of flow cytometry analysis of Tregs (CD4+CD25+FoxP3+) in the tumor. (p) Quantitative analysis of the proportion of CD4+CD25+FoxP3+ Tregs in (o) (n = 3, mean ± s.d.). Statistical analyses were conducted using one-way ANOVA followed by Tukey’s test. Student’s t-test was used upon observing significant differences between groups. * p < 0.05, ** p < 0.01, *** p < 0.001, **** p < 0.0001.
Figure 3
Figure 3
ICD tumor cells induced by ER-targeted phototherapy triggered a robust anti-tumor immunity in 4T-1-bearing mice. (a) The workflow for the tumor treatment experiment. (b) Tumor volume curves during the treatment period (n = 5, mean ± s.d.). (c) Images of tumors (n = 5). (d) Representative images of flow cytometry analysis of DC maturation (CD80+CD86+) in primary lymph nodes. (e) Quantitative analysis of the proportion of CD80+CD86+ DCs in (d) (n = 3, mean ± s.d.). (f) Representative images of flow cytometry analysis of DC maturation (CD80+CD86+) in distant lymph nodes. (g) Quantitative analysis of the proportion of CD80+CD86+ DCs in (f) (n = 3, mean ± s.d.). (h) Representative images of flow cytometry analysis of T lymphocytes (CD3+CD8+) in the tumor. (i) Quantitative analysis of the proportion of CD3+CD8+ T lymphocytes in (h) (n = 3, mean ± s.d.). (j) Representative images of flow cytometry analysis of Tregs (CD4+CD25+FoxP3+) in the tumor. (k) Quantitative analysis of the proportion of CD4+CD25+FoxP3+ Tregs in (j) (n = 3, mean ± s.d.). (l) Quantitative analysis of the concentration of IFN-γ in serum (n = 3, mean ± s.d.). Student’s t-test was used upon observing significant differences between groups. * p < 0.05, ** p < 0.01, and *** p < 0.001.
Figure 4
Figure 4
ER-targeted phototherapy upregulated antigen processing and immune signaling pathways in 4T-1 cells. (a) Volcano plots demonstrate the upregulated and downregulated DEGs in the ER-Cy-poNO2 + Laser group compared with the PBS group, with red indicating high expression and blue indicating low expression levels (log2|Fold change| > 1, p adj. value < 0.05). (b) The heatmap demonstrates the upregulated and downregulated DEGs, with red indicating high expression and blue indicating low expression levels. (c) The GO enrichment analysis of upregulated DEGs in the ER-Cy-poNO2 + Laser group compared with the PBS group. (d) The KEGG enrichment analysis of DEGs in the ER-Cy-poNO2 + Laser group compared with the PBS group. (e) The GSEA enrichment analysis of antigen processing and presentation (MMU04612) in the ER-Cy-poNO2 + Laser group compared with the PBS group. (f) The expression differences in key genes in pathway antigen processing and presentation (MMU04612).
Figure 5
Figure 5
ER-targeted phototherapy remodeled the immunopeptidome of 4T-1 cells generating upregulated high-affinity MHC-I ligands. (a) The workflow for identifying the 4T-1 cell-derived MIP. (b) Length distributions of MIP derived from the PBS group, ER-Cy-poNO2 + Laser group, and total (7–16 amino acids). (c) The overlap of the MIP between the PBS group and ER-Cy-poNO2 + Laser group. (d) Volcano plots demonstrate the upregulated and downregulated differentially expressed MIP in the ER-Cy-poNO2 + Laser group compared with the PBS group among shared immunopeptides in (c), with red indicating high expression and blue indicating low expression levels (log2|Fold change| > 1, P value < 0.05). (e) The predicted affinities of peptides by NetMHCpan-4.1, SB: strong binder (% Rank < 0.5); WB: weak binder (%Rank:0.5–2). (f) The binding motifs of the 9-mer peptides identified in the 4T-1 cell-derived MIP with different treatments. The x-axis represents the residue position within the 9-mer peptide sequence. The y-axis represents the information content, with the size of each amino acid symbol proportional to its frequency.
Figure 6
Figure 6
The IF4G3986–994 peptide demonstrated a pronounced immunogenicity advantage over the other tested candidates. (a) The illustration depicts the pipeline for immunopeptides’ selection for the immunogenicity assessment. (b) The illustration depicts the amino acid sequences, source proteins, and haplotypes of the 15 synthesized candidate immunopeptides. (c) The workflow for the recall IFN-γ ELISPOT assay. (d) Representative ELISPOT images showing IFN-γ produced by the indicated peptide-primed BALB/c mice splenocytes restimulated with BMDCs alone (BMDCs + no peptide) or the indicated peptide-pulsed BMDCs (BMDCs + indicated peptide). The blk group refers to the blank control (i.e., wells containing splenocytes and culture medium without any peptide stimulation). The pos group refers to the positive control (i.e., wells containing splenocytes and PMA plus ionomycin). The neg group refers to the negative control (i.e., wells containing splenocytes and BMDCs without peptide stimulation). (e) The summary data for the assay in (d) showing the mean IFN-γ spots number per 1 × 10⁵ splenocytes ± s.d. in duplicate cultures (n = 3, mean ± s.d.). (f) Quantitative analysis of the proportion of CD80+CD86+ BMDCs in Figure S10 (n = 3, mean ± s.d.).
Figure 7
Figure 7
The highly immunogenic peptide IF4G3986–994 could effectively activate the anti-tumor immune response and subsequently inhibit tumor growth in mice. (a) The workflow for the IF4G3986–994 in vivo tumor vaccine experiment. (b) Representative ELISPOT images showing IFN-γ spots of splenocytes from mice subjected to different treatments. (c) Summary data for the assay in (b) showing the mean IFN-γ spot number per 2 × 10⁵ splenocytes ± s.d. in duplicate cultures. (n = 3, mean ± s.d.). (d) Tumor volume curves during the treatment period (n = 4, mean ± s.d.). (e) Images of tumors (n = 4). (f) Tumor weights on day 21 after various treatments (n = 4, mean ± s.d.). (g) Representative images of flow cytometry analysis of DCs’ maturation (CD80+CD86+) in lymph nodes. (h) Quantitative analysis of the proportion of CD80+CD86+ DCs from (g) (n = 3, mean ± s.d.). (i) Representative images of flow cytometry analysis of T lymphocytes (CD3+CD8+) in the spleen. (j) Quantitative analysis of the proportion of CD3+CD8+ T lymphocytes from (i) (n = 3, mean ± s.d.). (k) Representative images of flow cytometry analysis of T lymphocytes (CD8+IFN-γ+) in the spleen. (l) Quantitative analysis of the proportion of CD8+IFN-γ+ T lymphocytes from (k) (n = 3, mean ± s.d.). (m) Representative images of flow cytometry analysis of Tregs (CD4+CD25+FoxP3+) in the tumor. (n) Quantitative analysis of the proportion of CD4+CD25+FoxP3+ Tregs from (m) (n = 3, mean ± s.d.). Statistical analyses were conducted using one-way ANOVA followed by Tukey’s test. * p < 0.05, ** p < 0.01, *** p < 0.001, and **** p < 0.0001.

Similar articles

References

    1. Yuan X., Zhou J.-L., Yuan L., Fan J., Yoon J., Zhang X.-B., Peng X., Tan W. Phototherapy: Progress, challenges, and opportunities. Sci. China Chem. 2024;68:865. doi: 10.1007/s11426-024-2411-7. - DOI
    1. Shim G., Kim M.-G., Jin H., Kim J., Oh Y.-K. Claudin 4-targeted nanographene phototherapy using a Clostridium perfringens enterotoxin peptide-photosensitizer conjugate. Acta Pharmacol. Sin. 2017;38:954–962. doi: 10.1038/aps.2017.46. - DOI - PMC - PubMed
    1. Wang Y., Ma K., Kang M., Yan D., Niu N., Yan S., Sun P., Zhang L., Sun L., Wang D., et al. A new era of cancer phototherapy: Mechanisms and applications. Chem. Soc. Rev. 2024;53:12014–12042. doi: 10.1039/d4cs00708e. - DOI - PubMed
    1. Overchuk M., Weersink R.A., Wilson B.C., Zheng G. Photodynamic and photothermal therapies: Synergy opportunities for nanomedicine. ACS Nano. 2023;17:7979–8003. doi: 10.1021/acsnano.3c00891. - DOI - PMC - PubMed
    1. Sun Z., Zhao M., Wang W., Hong L., Wu Z., Luo G., Lu S., Tang Y., Li J., Wang J., et al. 5-ALA mediated photodynamic therapy with combined treatment improves anti-tumor efficacy of immunotherapy through boosting immunogenic cell death. Cancer Lett. 2023;554:216032. doi: 10.1016/j.canlet.2022.216032. - DOI - PubMed

LinkOut - more resources