Selection of Optimal Diagnostic Positions for Early Nutrient Deficiency in Cucumber Leaves Based on Spatial Distribution of Raman Spectra
- PMID: 40284087
- PMCID: PMC12030572
- DOI: 10.3390/plants14081199
Selection of Optimal Diagnostic Positions for Early Nutrient Deficiency in Cucumber Leaves Based on Spatial Distribution of Raman Spectra
Abstract
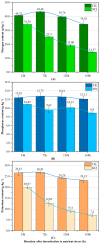
Accurate diagnosis of crop nutritional status is critical for optimizing yield and quality in modern agriculture. This study enhances the accuracy of Raman spectroscopy-based nutrient diagnosis, improving its application in precision agriculture. We propose a method to identify optimal diagnostic positions on cucumber leaves for early detection of nitrogen (N), phosphorus (P), and potassium (K) deficiencies, thereby providing a robust scientific basis for high-throughput phenotyping using Raman spectroscopy (RS). Using a dot-matrix approach, we collected RS data across different leaf positions and explored the selection of diagnostic positions through spectral cosine similarity analysis. These results provide critical insights for developing rapid, non-destructive methods for nutrient stress monitoring in crops. Results show that spectral similarity across positions exhibits higher instability during the early developmental stages of leaves or under short-term (24 h) nutrient stress, with significant differences in the stability of spectral data among treatment groups. However, visual analysis of the spatial distribution of positions with lower similarity values reveals consistent spectral similarity distribution patterns across different treatment groups, with the lower similarity values predominantly observed at the leaf margins, near the main veins, and at the leaf base. Excluding low-similarity data significantly improved model performance for early (24 h) nutrient deficiency diagnosis, resulting in higher precision, recall, and F1 scores. Based on these results, the efficacy of the proposed method for selecting diagnostic positions has been validated. It is recommended to avoid collecting RS data from areas near the leaf margins, main veins, and the leaf base when diagnosing early nutrient deficiencies in plants to enhance diagnostic accuracy.
Keywords: Raman spectroscopy; cucumbers; leaf position; nitrogen; nutrient deficiency; phosphorus; potassium; precision agriculture.
Conflict of interest statement
The authors declare no conflicts of interest.
Figures


Similar articles
-
Diagnosis of early nitrogen, phosphorus and potassium deficiency categories in rice based on multimodal integration and knowledge distillation.Sci Rep. 2025 Apr 15;15(1):13014. doi: 10.1038/s41598-025-97585-0. Sci Rep. 2025. PMID: 40234533 Free PMC article.
-
Rapid detection of soybean nutrient deficiencies with YOLOv8s for precision agriculture advancement.Sci Rep. 2025 Apr 21;15(1):13810. doi: 10.1038/s41598-024-83295-6. Sci Rep. 2025. PMID: 40258823 Free PMC article.
-
Raman Spectroscopy Enables Non-invasive and Confirmatory Diagnostics of Salinity Stresses, Nitrogen, Phosphorus, and Potassium Deficiencies in Rice.Front Plant Sci. 2020 Oct 22;11:573321. doi: 10.3389/fpls.2020.573321. eCollection 2020. Front Plant Sci. 2020. PMID: 33193509 Free PMC article.
-
Raman-Based Diagnostics of Biotic and Abiotic Stresses in Plants. A Review.Front Plant Sci. 2021 Jan 20;11:616672. doi: 10.3389/fpls.2020.616672. eCollection 2020. Front Plant Sci. 2021. PMID: 33552109 Free PMC article. Review.
-
Dissection of Crop Metabolome Responses to Nitrogen, Phosphorus, Potassium, and Other Nutrient Deficiencies.Int J Mol Sci. 2022 Aug 13;23(16):9079. doi: 10.3390/ijms23169079. Int J Mol Sci. 2022. PMID: 36012343 Free PMC article. Review.
References
-
- Gebbers R., Adamchuk V.I.J. Precision agriculture and food security. Science. 2010;327:828–831. - PubMed
-
- Lemaire G., Tang L., Bélanger G., Zhu Y., Jeuffroy M.-H. Forward new paradigms for crop mineral nutrition and fertilization towards sustainable agriculture. Eur. J. Agron. 2021;125:126248.
-
- Kant S., Bi Y.-M., Rothstein S.J. Understanding plant response to nitrogen limitation for the improvement of crop nitrogen use efficiency. J. Exp. Bot. 2011;62:1499–1509. - PubMed
-
- Ohyama T. Nitrogen as a major essential element of plants. Nitrogen Assim. Plants. 2010;37:1–17.
Grants and funding
- 2023YFD2301605/the National Key Research and Development Program
- PL2024E024/Heilongjiang Provincial Natural Science Foundation of China
- LH2019E072/Heilongjiang Provincial Natural Science Foundation Joint Guidance Program
- GZ20220020/the Key Research and Development Program of Heilongjiang Province
- LH2023F043/the Heilongjiang Natural Science Foundation
- ZRCPY202015/the Natural Science Talent Support Program of Heilongjiang Bayi Agricultural University
- SJGY20210622/the Higher Education Teaching Reform Research Project of Heilongjiang Province
- ZRCPY202120/the San-Zong Scientific Research Support Program of Heilongjiang Bayi Agricultural University
- XDB202211/the 2022 Doctoral Startup Fund of Heilongjiang Bayi Agricultural University
LinkOut - more resources
Full Text Sources

