. 2025 Apr 11;17(8):1324.
doi: 10.3390/nu17081324.

Lipoprotein(a) and Risk of Incident Atherosclerotic Cardiovascular Disease: Impact of High-Sensitivity C-Reactive Protein and Risk Variability Among Human Clinical Subgroups

Affiliations

Lipoprotein(a) and Risk of Incident Atherosclerotic Cardiovascular Disease: Impact of High-Sensitivity C-Reactive Protein and Risk Variability Among Human Clinical Subgroups

Ron C Hoogeveen et al. Nutrients. .

Abstract

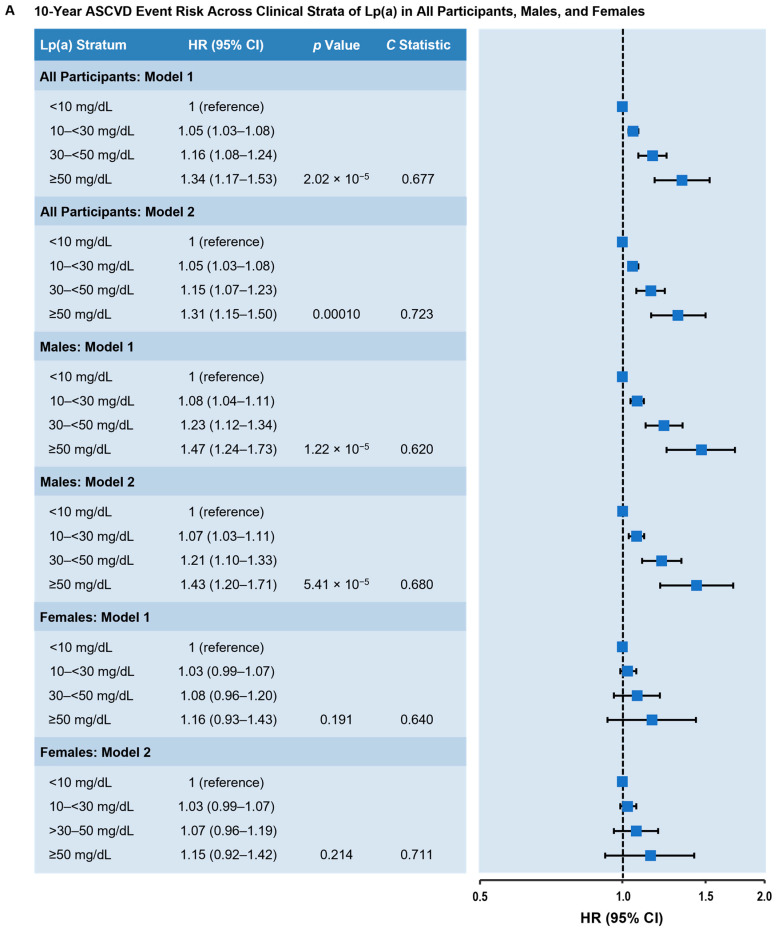
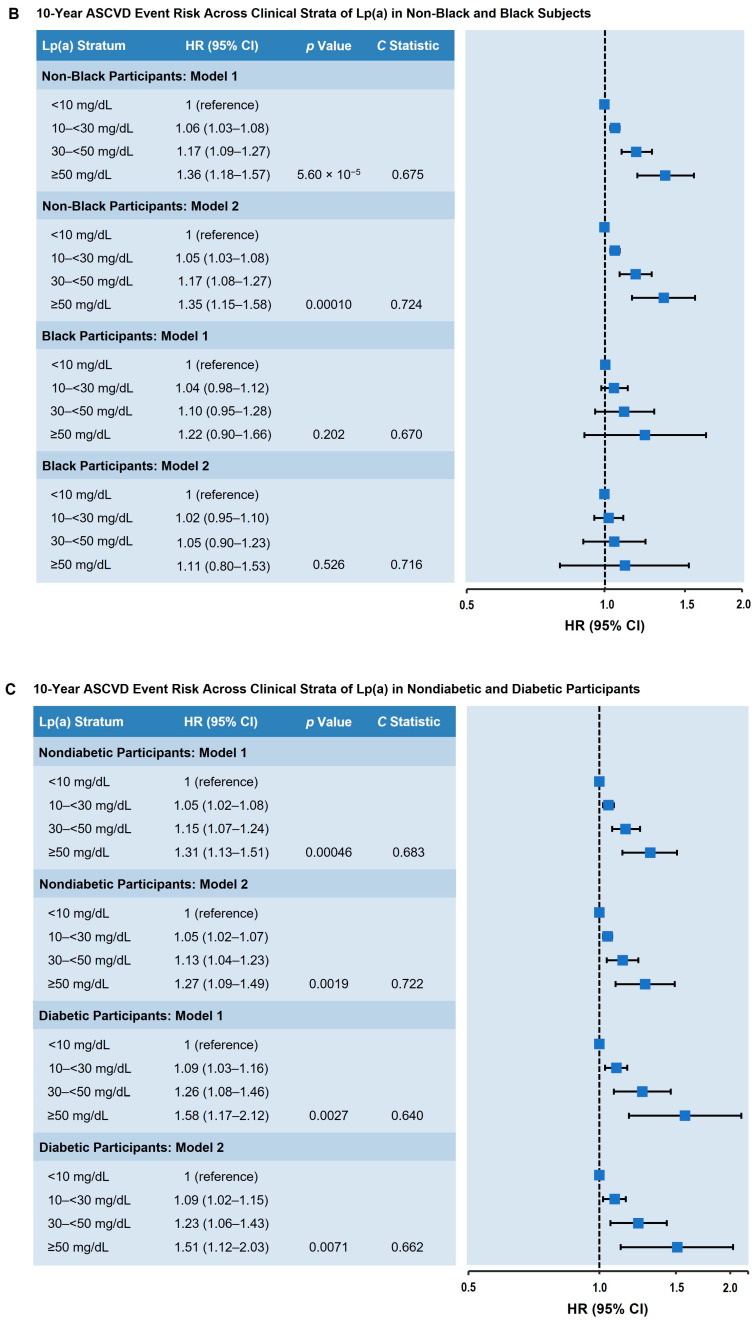
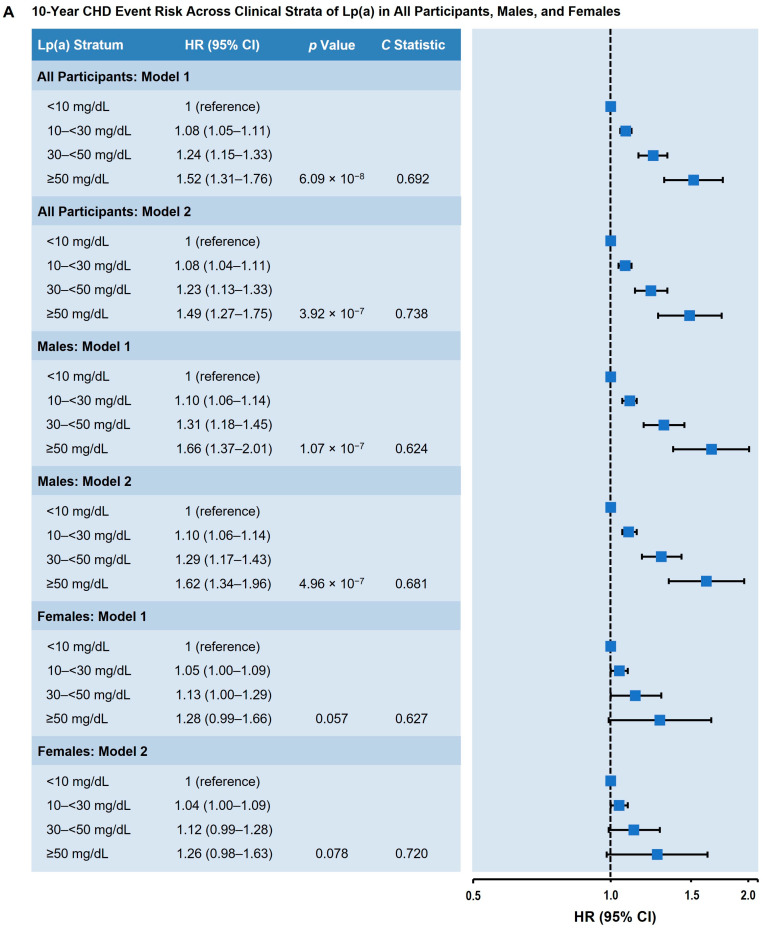
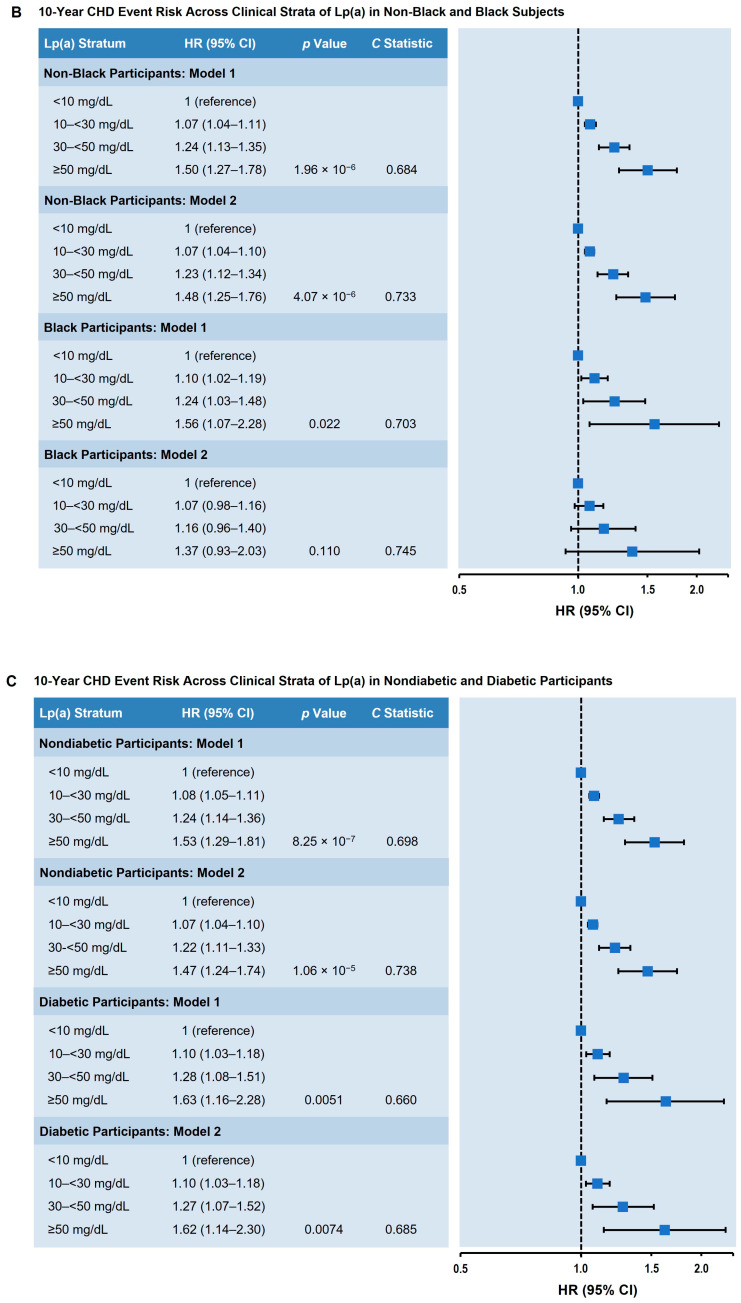
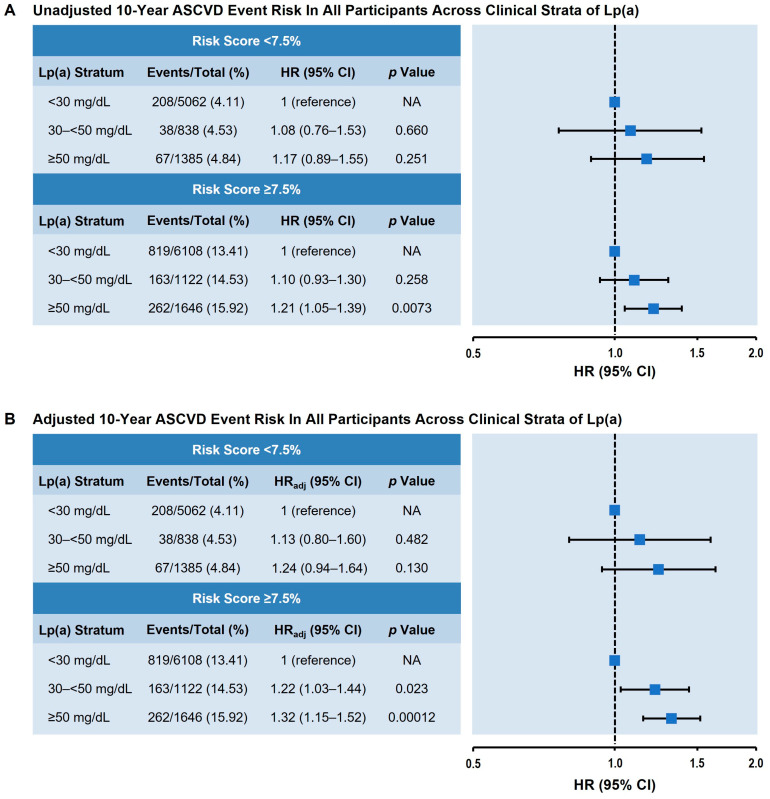
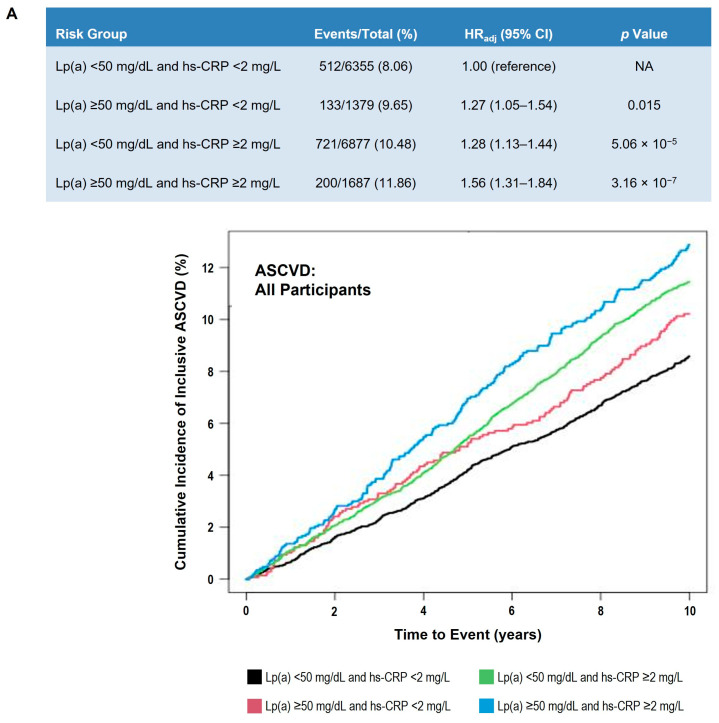
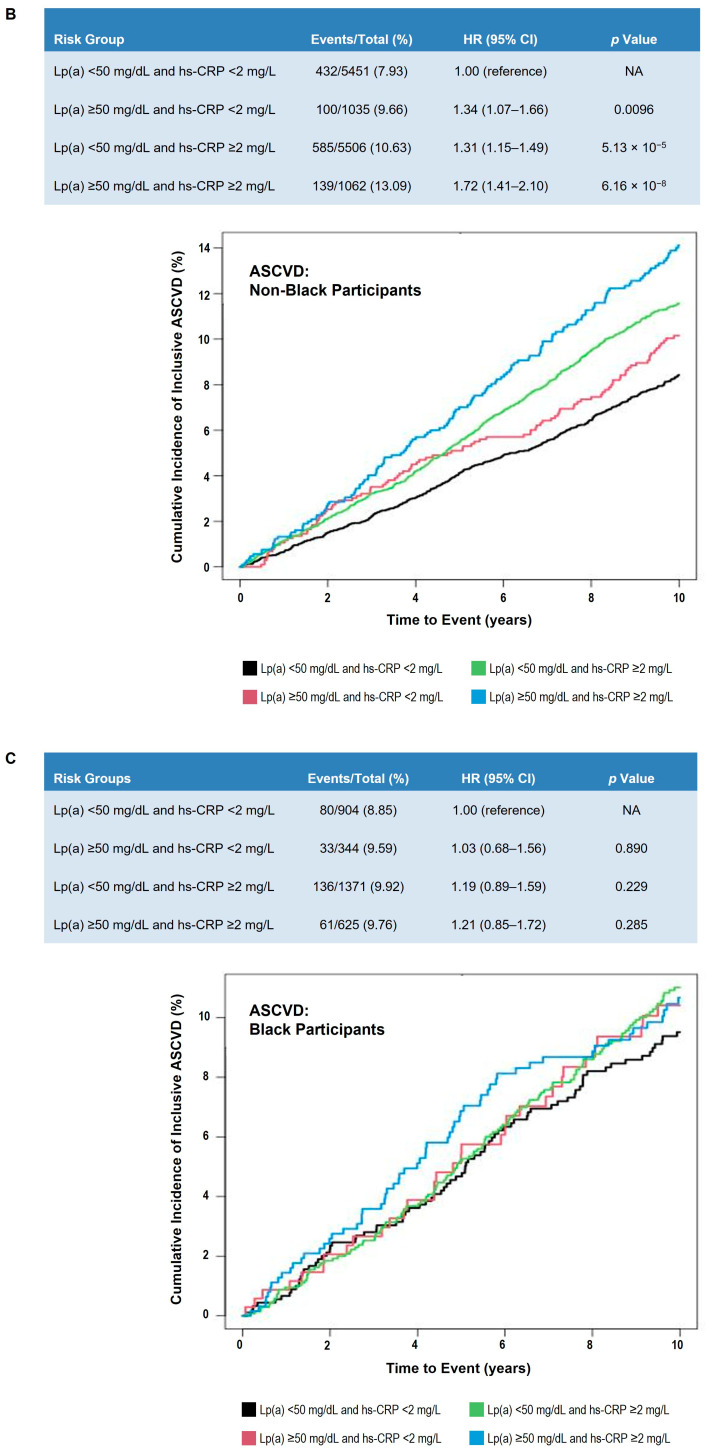
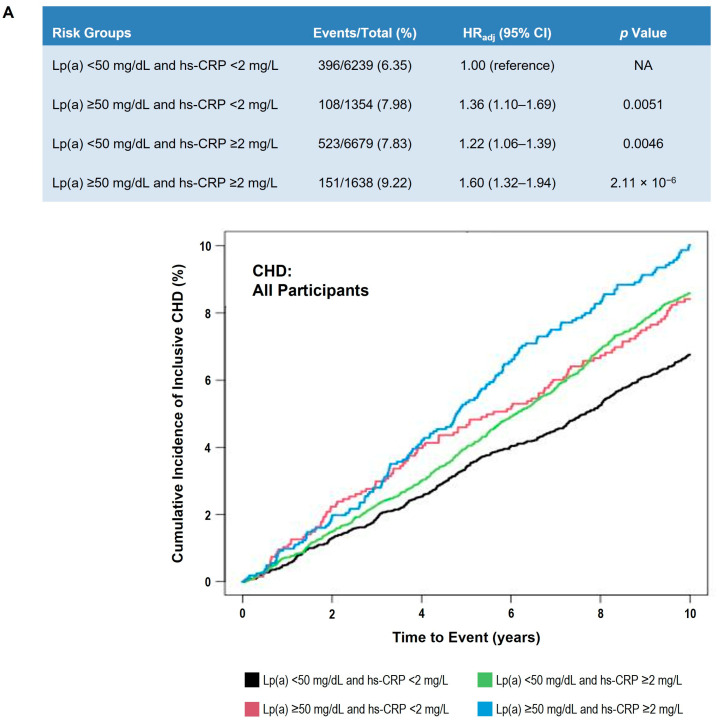
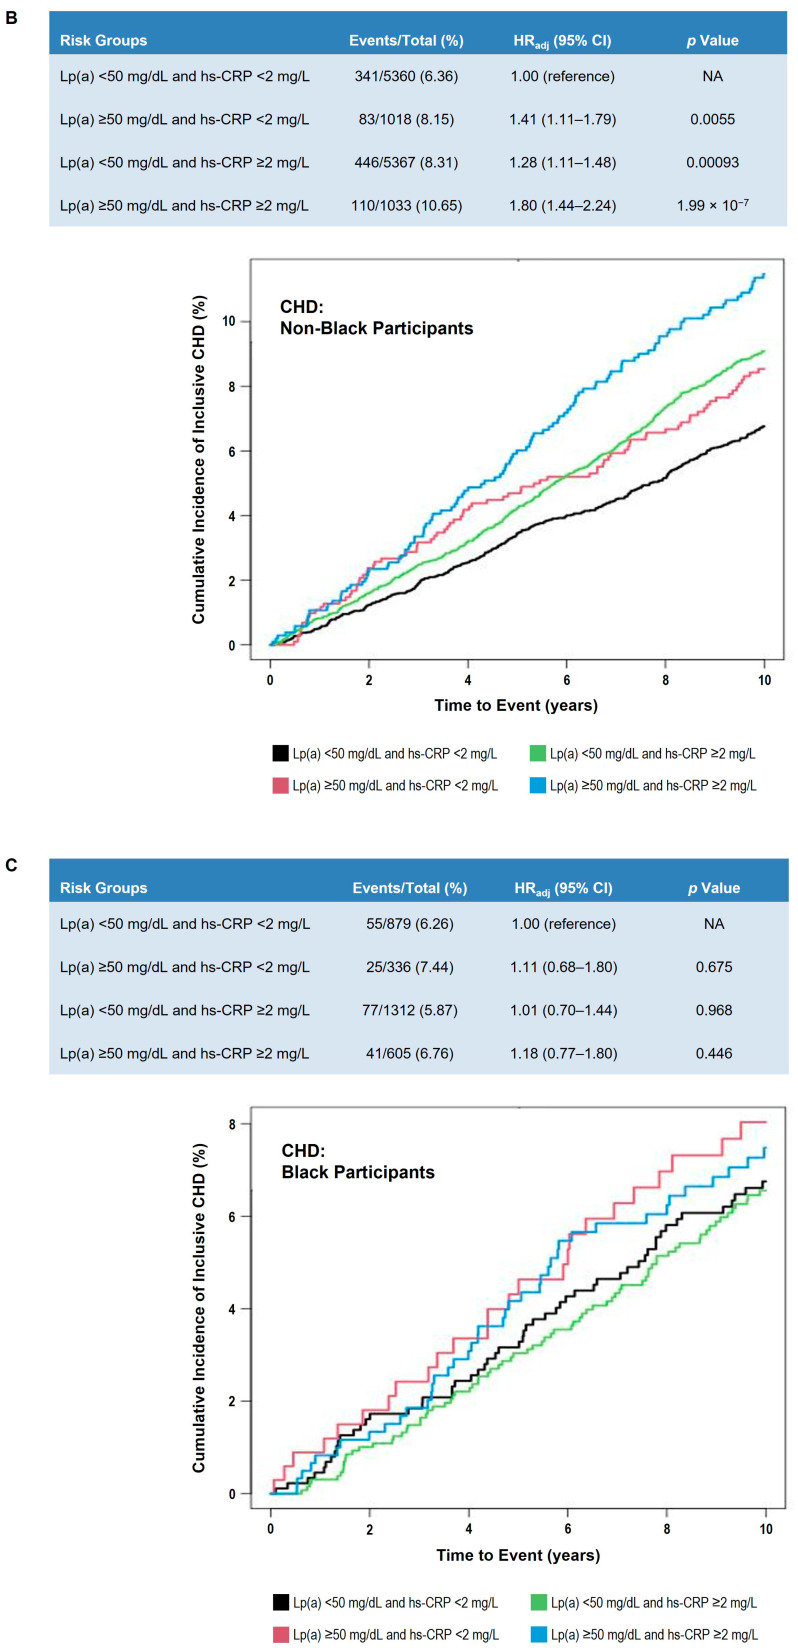
Background/Objectives: Elevated lipoprotein(a) [Lp(a)] is associated with increased incidence of atherosclerotic cardiovascular disease (ASCVD). We aimed to assess the utility of Lp(a) as an ASCVD risk-enhancing factor, as recommended by the 2019 ACC/AHA guidelines on ASCVD primary prevention, and to determine whether C-reactive protein (CRP) modifies the association of elevated Lp(a) with ASCVD risk. Methods: Lp(a), high sensitivity CRP (hs-CRP), and other ASCVD risk factors, including blood lipids, blood pressure, diabetes status, body weight and height, and smoking, were measured in 15,933 participants (median age 61.7 years with 25th-75th percentiles 57-68 years, 56.7% female, 19.7% Black, free of ASCVD at baseline) in the Atherosclerosis Risk in Communities Study, Framingham Offspring Study, and Multi-Ethnic Study of Atherosclerosis. Participants were followed for 10 years for incident ASCVD (coronary heart disease (CHD) or stroke) and CHD (including angioplasty and/or coronary artery bypass but minus stroke). These endpoints occurred in 9.7% and 7.4% of subjects, respectively. Results: Compared with the lowest Lp(a) category (<10 mg/dL), the highest Lp(a) category (≥50 mg/dL) carried a significantly increased incidence of ASCVD (hazard ratio [HR] = 1.31; 95% confidence interval [CI] 1.15-1.50; p < 0.001) and CHD (HR = 1.49; 95%CI 1.27-1.75; p < 0.001). The association of elevated Lp(a) with incident ASCVD was stronger in males and non-Black individuals and was independent of diabetes status. Lp(a) levels ≥ 50 mg/dL predicted the 10-year ASCVD risk for those at intermediate risk (≥7.5%, HR = 1.32; 95%CI 1.15-1.52; p < 0.001). There was a significant interaction between Lp(a) and hs-CRP; individuals with concomitant elevated levels of Lp(a) and hs-CRP had the highest ASCVD risk. Conclusions: Elevated Lp(a) levels were associated with increased ASCVD risk, particularly in individuals with concomitantly elevated hs-CRP levels and those at intermediate 10-year ASCVD risk.

Keywords: CRP; Lp(a); cardiovascular disease; diabetes.


Conflict of interest statement

R.C.H. has received research grants (to his institution) from Denka Corporation (Tokyo, Japan). R.C.H. and C.M.B. are consultants for Denka Seiken (Tokyo, Japan). M.R.D. is an employee of Boston Heart Diagnostics Corporation. None of the other authors have any relevant relationships or conflicts of interest to disclose.

Figures

Figure 1
Figure 1
Adjusted 10-year inclusive ASCVD event risk across clinical strata of Lp(a). (A) All participants, males, and females. (B) Non-Black and Black participants. (C) Non-diabetic and diabetic participants. Model 1: Adjusted for age, sex, and race. Model 2: Adjusted for age, sex, race, diabetes status, hypertension, hypertension treatment, smoking status, total cholesterol, high-density lipoprotein cholesterol, and cholesterol-lowering medication use. Lp(a) values were classified according to prespecified clinical strata. The HR (95% CI) is shown in comparison to the Lp(a) < 10 mg/dL stratum (reference). p value represents trend across the categories; the C statistic represents the probably of an event across the categories. Abbreviations: ASCVD, atherosclerotic cardiovascular disease; CI, confidence interval; HR, hazard ratio; Lp(a), lipoprotein(a).
Figure 1
Figure 1
Adjusted 10-year inclusive ASCVD event risk across clinical strata of Lp(a). (A) All participants, males, and females. (B) Non-Black and Black participants. (C) Non-diabetic and diabetic participants. Model 1: Adjusted for age, sex, and race. Model 2: Adjusted for age, sex, race, diabetes status, hypertension, hypertension treatment, smoking status, total cholesterol, high-density lipoprotein cholesterol, and cholesterol-lowering medication use. Lp(a) values were classified according to prespecified clinical strata. The HR (95% CI) is shown in comparison to the Lp(a) < 10 mg/dL stratum (reference). p value represents trend across the categories; the C statistic represents the probably of an event across the categories. Abbreviations: ASCVD, atherosclerotic cardiovascular disease; CI, confidence interval; HR, hazard ratio; Lp(a), lipoprotein(a).
Figure 2
Figure 2
Adjusted 10-year CHD risk across clinical strata of Lp(a). (A) All participants, males, and females. (B) Non-Black and Black participants. (C) Non-diabetic and diabetic participants. Model 1: Adjusted for age, sex, and race. Model 2: Adjusted for age, sex, race, diabetes status, hypertension, hypertension treatment, smoking status, total cholesterol, high-density lipoprotein cholesterol, and cholesterol-lowering medication use. Lp(a) values were classified according to prespecified clinical strata. The HR (95% CI) is shown in comparison to the Lp(a) < 10 mg/dL stratum (reference). p value represents trend across the categories; the C statistic represents the probably of an event across the categories. Abbreviations: CHD, coronary heart disease; CI, confidence interval; HR, hazard ratio; Lp(a), lipoprotein(a).
Figure 2
Figure 2
Adjusted 10-year CHD risk across clinical strata of Lp(a). (A) All participants, males, and females. (B) Non-Black and Black participants. (C) Non-diabetic and diabetic participants. Model 1: Adjusted for age, sex, and race. Model 2: Adjusted for age, sex, race, diabetes status, hypertension, hypertension treatment, smoking status, total cholesterol, high-density lipoprotein cholesterol, and cholesterol-lowering medication use. Lp(a) values were classified according to prespecified clinical strata. The HR (95% CI) is shown in comparison to the Lp(a) < 10 mg/dL stratum (reference). p value represents trend across the categories; the C statistic represents the probably of an event across the categories. Abbreviations: CHD, coronary heart disease; CI, confidence interval; HR, hazard ratio; Lp(a), lipoprotein(a).
Figure 3
Figure 3
The 10-year ASCVD event risk of all participants across clinical strata of Lp(a) dichotomized by pooled cohort equation risk score. (A) Unadjusted event risk. (B) Adjusted event risk, adjusted for age, sex, race, systolic blood pressure, hypertension treatment, total cholesterol, smoking status, and high-density lipoprotein cholesterol. Lp(a) values were classified according to prespecified clinical strata. HR (95% CI), HRadj, and p value are shown in comparison to the Lp(a) < 30 mg/dL stratum (reference). Abbreviations: ASCVD, atherosclerotic cardiovascular disease; CI, confidence interval; HR, hazard ratio; HRadj, adjusted hazard ratio; Lp(a), lipoprotein(a).
Figure 4
Figure 4
Adjusted 10-year ASCVD event risk in participants classified by Lp(a) and hs-CRP levels. (A) All participants. (B) Non-Black participants. (C) Black participants. Table shows number of events, HRadj, and p value by Lp(a) and hs-CRP clinical strata. Cox proportional hazards model was adjusted for age, sex, race (Panel A only), systolic blood pressure, hypertension treatment, smoking status, diabetes status, total cholesterol, high-density lipoprotein cholesterol, and cholesterol-lowering medication use. Lp(a) < 50 mg/dL and hs-CRP < 2 mg/L was used as the reference group. Graph presents Kaplan–Meier curves of cumulative incidence of events by prespecified Lp(a) and hs-CRP clinical strata. Black line indicates Lp(a) < 50 mg/dL and hs-CRP < 2 mg/L; red line shows Lp(a) ≥ 50 mg/dL and hs-CRP < 2 mg/L; green line shows Lp(a) < 50 mg/dL and hs-CRP ≥ 2 mg/L; blue line shows ≥50 mg/dL and hs-CRP ≥ 2 mg/dL. Abbreviations: ASCVD, atherosclerotic cardiovascular disease; CHD, coronary heart disease; CI, confidence interval; HR, hazard ratio; HRadj, adjusted hazard ratio; hs-CRP, high sensitivity C-reactive protein; Lp(a), lipoprotein(a).
Figure 4
Figure 4
Adjusted 10-year ASCVD event risk in participants classified by Lp(a) and hs-CRP levels. (A) All participants. (B) Non-Black participants. (C) Black participants. Table shows number of events, HRadj, and p value by Lp(a) and hs-CRP clinical strata. Cox proportional hazards model was adjusted for age, sex, race (Panel A only), systolic blood pressure, hypertension treatment, smoking status, diabetes status, total cholesterol, high-density lipoprotein cholesterol, and cholesterol-lowering medication use. Lp(a) < 50 mg/dL and hs-CRP < 2 mg/L was used as the reference group. Graph presents Kaplan–Meier curves of cumulative incidence of events by prespecified Lp(a) and hs-CRP clinical strata. Black line indicates Lp(a) < 50 mg/dL and hs-CRP < 2 mg/L; red line shows Lp(a) ≥ 50 mg/dL and hs-CRP < 2 mg/L; green line shows Lp(a) < 50 mg/dL and hs-CRP ≥ 2 mg/L; blue line shows ≥50 mg/dL and hs-CRP ≥ 2 mg/dL. Abbreviations: ASCVD, atherosclerotic cardiovascular disease; CHD, coronary heart disease; CI, confidence interval; HR, hazard ratio; HRadj, adjusted hazard ratio; hs-CRP, high sensitivity C-reactive protein; Lp(a), lipoprotein(a).
Figure 5
Figure 5
Adjusted 10-year CHD event risk in participants classified by Lp(a) and hs-CRP levels. (A) All participants. (B) Non-Black participants. (C) Black participants. Table shows number of events, HRadj (95% CI), and p value by Lp(a) and hs-CRP clinical strata. Cox proportional hazards model was adjusted for age, sex, race (Panel A only), systolic blood pressure, hypertension treatment, smoking status, diabetes status, total cholesterol, high-density lipoprotein cholesterol, and cholesterol-lowering medication use. Lp(a) < 50 mg/dL and hs-CRP < 2 mg/L was used as the reference group. Graph presents Kaplan–Meier curves of cumulative incidence of events by prespecified Lp(a) and hs-CRP clinical strata. Black line indicates Lp(a) < 50 mg/dL and hs-CRP < 2 mg/L; red line shows Lp(a) ≥ 50 mg/dL and hs-CRP < 2 mg/L; green line shows Lp(a) < 50 mg/dL and hs-CRP ≥ 2 mg/L; blue line shows ≥50 mg/dL and hs-CRP ≥ 2 mg/dL. Abbreviations: CHD, coronary heart disease; CI, confidence interval; HRadj, adjusted hazard ratio; hs-CRP, high-sensitivity C-reactive protein; Lp(a), lipoprotein(a).
Figure 5
Figure 5
Adjusted 10-year CHD event risk in participants classified by Lp(a) and hs-CRP levels. (A) All participants. (B) Non-Black participants. (C) Black participants. Table shows number of events, HRadj (95% CI), and p value by Lp(a) and hs-CRP clinical strata. Cox proportional hazards model was adjusted for age, sex, race (Panel A only), systolic blood pressure, hypertension treatment, smoking status, diabetes status, total cholesterol, high-density lipoprotein cholesterol, and cholesterol-lowering medication use. Lp(a) < 50 mg/dL and hs-CRP < 2 mg/L was used as the reference group. Graph presents Kaplan–Meier curves of cumulative incidence of events by prespecified Lp(a) and hs-CRP clinical strata. Black line indicates Lp(a) < 50 mg/dL and hs-CRP < 2 mg/L; red line shows Lp(a) ≥ 50 mg/dL and hs-CRP < 2 mg/L; green line shows Lp(a) < 50 mg/dL and hs-CRP ≥ 2 mg/L; blue line shows ≥50 mg/dL and hs-CRP ≥ 2 mg/dL. Abbreviations: CHD, coronary heart disease; CI, confidence interval; HRadj, adjusted hazard ratio; hs-CRP, high-sensitivity C-reactive protein; Lp(a), lipoprotein(a).

Similar articles

Cited by

References

    1. Utermann G. The mysteries of lipoprotein(a) Science. 1989;246:904–910. doi: 10.1126/science.2530631. - DOI - PubMed
    1. Kamstrup P.R., Tybjaerg-Hansen A., Steffensen R., Nordestgaard B.G. Genetically elevated lipoprotein(a) and increased risk of myocardial infarction. JAMA. 2009;301:2331–2339. doi: 10.1001/jama.2009.801. - DOI - PubMed
    1. Clarke R., Peden J.F., Hopewell J.C., Kyriakou T., Goel A., Heath S.C., Parish S., Barlera S., Franzosi M.G., Rust S., et al. Genetic variants associated with Lp(a) lipoprotein level and coronary disease. N. Engl. J. Med. 2009;361:2518–2528. doi: 10.1056/NEJMoa0902604. - DOI - PubMed
    1. Burgess S., Ference B.A., Staley J.R., Freitag D.F., Mason A.M., Nielsen S.F., Willeit P., Young R., Surendran P., Karthikeyan S., et al. Association of LPA variants with risk of coronary disease and the implications for lipoprotein(a)-lowering therapies: A Mendelian randomization analysis. JAMA Cardiol. 2018;3:619–627. doi: 10.1001/jamacardio.2018.1470. - DOI - PMC - PubMed
    1. Emerging Risk Factors Collaboration. Erqou S., Kaptoge S., Perry P.L., Di Angelantonio E., Thompson A., White I.R., Marcovina S.M., Collins R., Thompson S.G., et al. Lipoprotein(a) concentration and the risk of coronary heart disease, stroke, and nonvascular mortality. JAMA. 2009;302:412–423. doi: 10.1001/jama.2009.1063. - DOI - PMC - PubMed