

The Carbon Footprint of Diets with Different Exclusions of Animal-Derived Products: Exploratory Polish Study
- PMID: 40284240
- PMCID: PMC12030518
- DOI: 10.3390/nu17081377
The Carbon Footprint of Diets with Different Exclusions of Animal-Derived Products: Exploratory Polish Study
Abstract
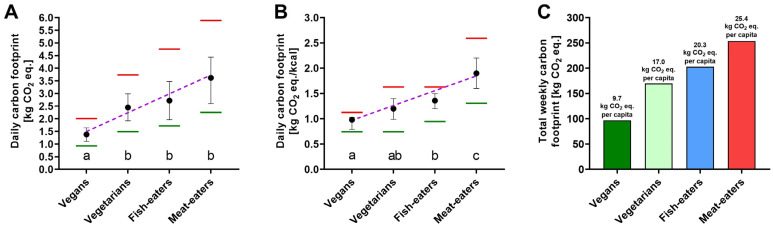
Background/Objectives: Analyzing the carbon footprint of diets in various populations is important as it can help identify more sustainable food choices that reduce the overall impact of human activities on ongoing warming of the global climate. This pilot exploratory study analyzed the carbon footprint (measured in kg of CO2 equivalent, eq.) using food diaries collected from Polish individuals with varying levels of animal-derived product exclusion in their diets. Methods: The study employed a food diary method, where participants from four dietary groups (vegan, vegetarian, fish-eater, and meat-eater) recorded all meals and beverages consumed over a 7-day period, including portion sizes and packaging details. These diaries were then analyzed to assess dietary adherence and calculate carbon footprints, utilizing standardized CO2 equivalent emission data from publicly available databases. Results: The analysis revealed a decreasing trend in the carbon footprint corresponding to the degree of elimination of animal-derived products from the diet (R2 = 0.96, p = 0.0217). The mean daily footprint in the vegan group was 1.38 kg CO2 eq., which was significantly lower than in the vegetarian (2.45), fish-eater (2.72), and meat-eater groups (3.62). For each 1000 kcal, the meat-eater diet generated 39.7, 58.3, and 93.9% more CO2 eq. than in the case of fish-eaters, vegetarians, and vegans, respectively. Over a week, a group of 10 vegans had a total carbon footprint lower than vegetarians, fish-eaters, and meat-eaters by 42.9, 52.2, and 61.8%, respectively. Hard and mozzarella cheese had the highest contribution to the carbon footprint in vegetarians, fish, and seafood in fish-eaters, and poultry, pork, and beef had the highest contribution in meat-eaters. Conclusions: Dietary carbon footprints vary considerably by dietary pattern, with lower consumption of animal-derived products associated with lower emissions. Additionally, identifying specific high-impact food items within each diet may inform strategies for reducing environmental impact across various eating patterns.
Keywords: animal products; climate change; environment; plant-based diets; sustainability.
Conflict of interest statement
The authors declare no conflicts of interest.
Figures
Similar articles
-
Dietary Intake of High-Protein Foods and Other Major Foods in Meat-Eaters, Poultry-Eaters, Fish-Eaters, Vegetarians, and Vegans in UK Biobank.Nutrients. 2017 Dec 2;9(12):1317. doi: 10.3390/nu9121317. Nutrients. 2017. PMID: 29207491 Free PMC article.
-
Comparison of Sociodemographic and Nutritional Characteristics between Self-Reported Vegetarians, Vegans, and Meat-Eaters from the NutriNet-Santé Study.Nutrients. 2017 Sep 15;9(9):1023. doi: 10.3390/nu9091023. Nutrients. 2017. PMID: 28926931 Free PMC article.
-
Cooking at Home, Fast Food, Meat Consumption, and Dietary Carbon Footprint among US Adults.Int J Environ Res Public Health. 2022 Jan 13;19(2):853. doi: 10.3390/ijerph19020853. Int J Environ Res Public Health. 2022. PMID: 35055675 Free PMC article.
-
Nutrient Intake and Status in Adults Consuming Plant-Based Diets Compared to Meat-Eaters: A Systematic Review.Nutrients. 2021 Dec 23;14(1):29. doi: 10.3390/nu14010029. Nutrients. 2021. PMID: 35010904 Free PMC article.
-
Carbon footprint and nutritional quality of different human dietary choices.Sci Total Environ. 2018 Dec 10;644:77-94. doi: 10.1016/j.scitotenv.2018.06.339. Epub 2018 Jul 4. Sci Total Environ. 2018. PMID: 29981520 Review.
References
-
- Lynas M., Houlton B.Z., Perry S. Greater than 99% Consensus on Human Caused Climate Change in the Peer-Reviewed Scientific Literature. Environ. Res. Lett. 2021;16:114005. doi: 10.1088/1748-9326/ac2966. - DOI
-
- Gasper R., Blohm A., Ruth M. Social and Economic Impacts of Climate Change on the Urban Environment. Curr. Opin. Environ. Sustain. 2011;3:150–157. doi: 10.1016/j.cosust.2010.12.009. - DOI
MeSH terms
LinkOut - more resources
Full Text Sources
