. 2025 Apr 19;17(8):1380.
doi: 10.3390/nu17081380.

Faecalibacterium duncaniae Mitigates Intestinal Barrier Damage in Mice Induced by High-Altitude Exposure by Increasing Levels of 2-Ketoglutaric Acid

Affiliations

Faecalibacterium duncaniae Mitigates Intestinal Barrier Damage in Mice Induced by High-Altitude Exposure by Increasing Levels of 2-Ketoglutaric Acid

Xianduo Sun et al. Nutrients. .

Abstract

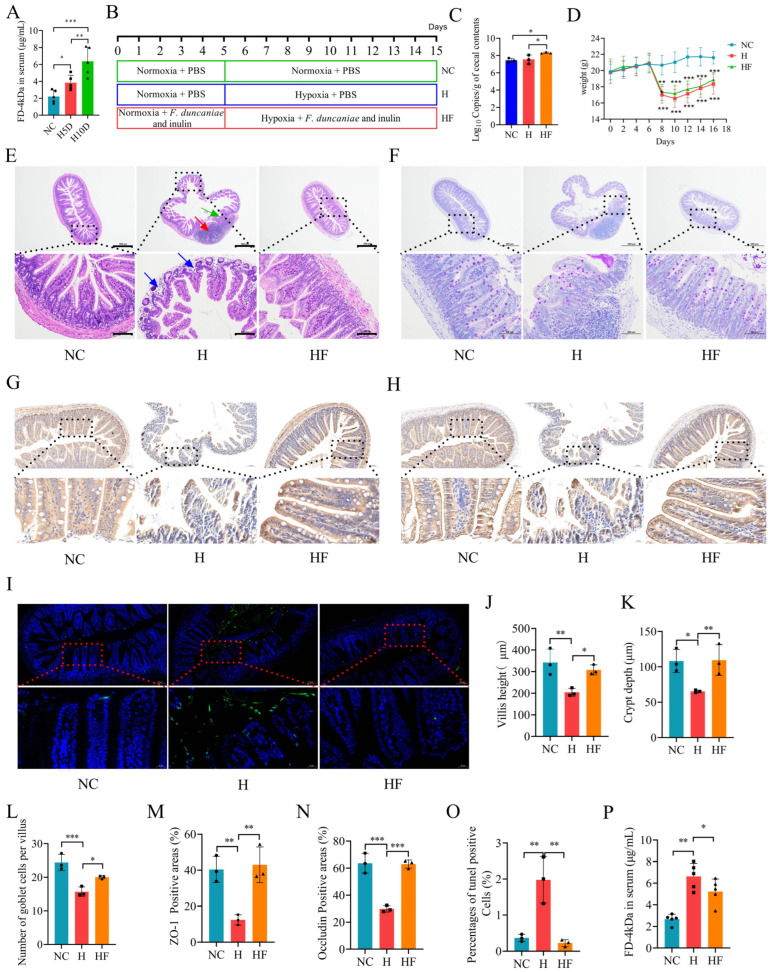
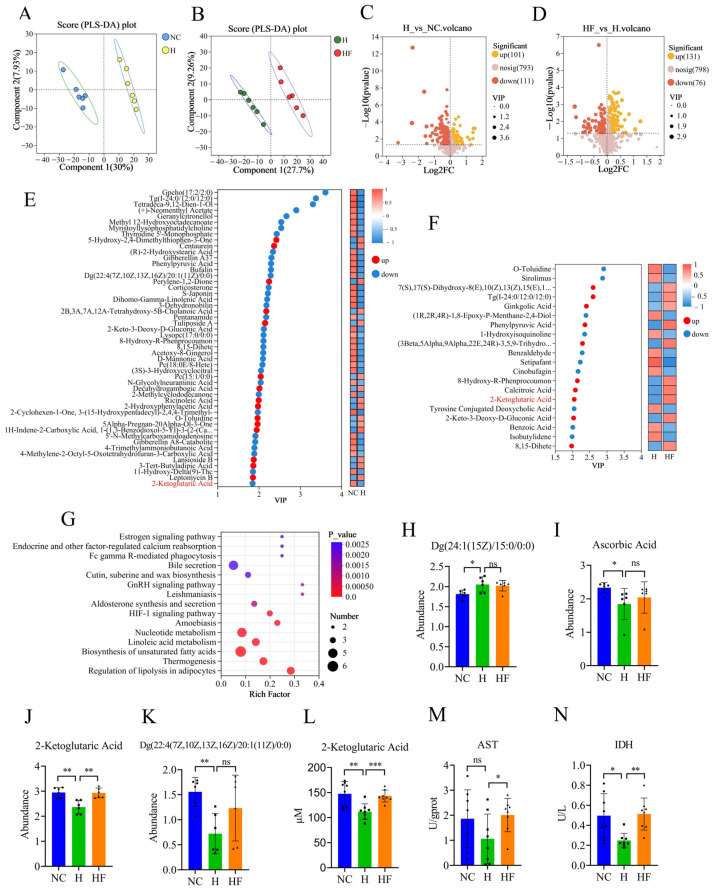
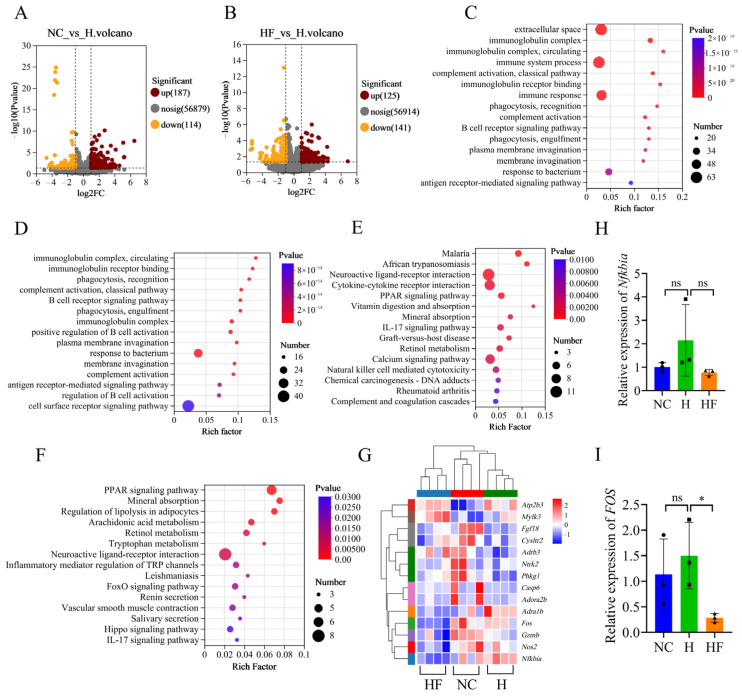
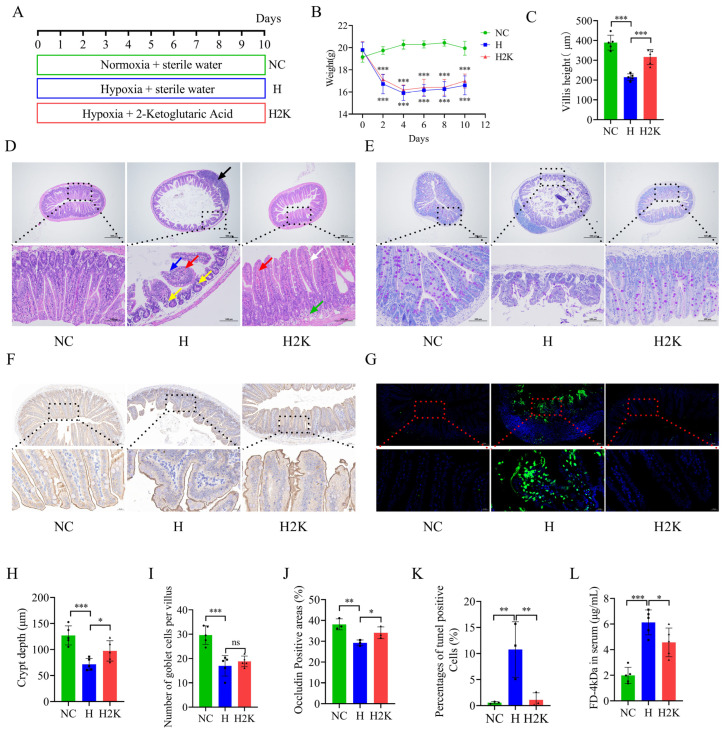
Background/Objectives: Exposure to high altitudes often results in gastrointestinal disorders. This study aimed to identify probiotic strains that can alleviate such disorders. Methods: We conducted a microbiome analysis to investigate the differences in gut microbiota among volunteers during the acute response and acclimatization phases at high altitudes. Subsequently, we established a mouse model of intestinal barrier damage induced by high-altitude exposure to further investigate the roles of probiotic strains and 2-ketoglutaric acid. Additionally, we performed untargeted metabolomics and transcriptomic analyses to elucidate the underlying mechanisms. Results: The microbiome analysis revealed a significant increase in the abundance of Faecalibacterium prausnitzii during the acclimatization phase. Faecalibacterium duncaniae (F. duncaniae) significantly mitigated damage to the intestinal barrier and the reduction of 2-ketoglutaric acid levels in the cecal contents induced by high-altitude exposure in mice. Immunohistochemistry and TUNEL staining demonstrated that high-altitude exposure significantly decreased the expression of ZO-1 and occludin while increasing apoptosis in ileal tissues. In contrast, treatment with F. duncaniae alleviated the loss of ZO-1 and occludin, as well as the apoptosis induced by high-altitude exposure. Furthermore, 2-ketoglutaric acid also mitigated this damage, reducing the loss of occludin and apoptosis in mice. Transcriptomic analysis indicated that high-altitude exposure significantly affects the calcium signaling pathway; conversely, the administration of F. duncaniae significantly influenced the PPAR signaling pathway, mineral absorption, and the regulation of lipolysis in adipocytes. Additionally, the expression of the FBJ osteosarcoma oncogene (Fos) was markedly reduced following the administration of F. duncaniae. Conclusions:F. duncaniae mitigates hypoxia-induced intestinal barrier damage by increasing levels of 2-ketoglutaric acid and shows promise as a probiotic, ultimately aiding travelers in adapting to high-altitude environments.

Keywords: 2-ketoglutaric acid; gastrointestinal issues; gut microbiota; hypoxia exposure; probiotics.


Conflict of interest statement

The authors declare no conflicts of interest.

Figures

Figure 1
Figure 1
Differences in gut microbiota between volunteers during the acute response and acclimatization phases at high altitude. (A,B) Pan/Core analysis. The Pan species curve (A) and Core species curve (B) illustrate changes in total and core species as the sample size increases. The flatness of the pan/core species curve helps determine the adequacy of the sequencing sample size. (C,D) Rarefaction curves based on the Sobs index (C) and Shannon index (D) provide valuable insights into the sufficiency of the sequencing data. A leveling off of the curve suggests that the sequencing data are adequate. (E,F) Comparison of alpha diversity between the Una and A groups, based on Chao’s index (richness) (E) and Shannon’s index (diversity) (F). (G) Comparison of the microbial dysbiosis index between the Una and A groups. (H) Partial Least Squares Discriminant Analysis. Each point represents an individual sample, with points sharing the same color and shape belonging to the same group. (I) Species composition of the Una and A groups at the genus level, with the bar chart displaying the top 15 genera by relative abundance. (J,K) Results of LEfSe analysis highlight significantly different bacterial taxa between the groups. The red color indicates a significant increase in the Una group, while blue indicates a significant increase in the A group. Statistical analyses were conducted using Student’s t-test (E,F) or the Wilcoxon rank-sum test (G), with ** indicating p < 0.01 and “ns” indicating no significant difference.
Figure 2
Figure 2
F. duncaniae mitigates intestinal barrier damage induced by high-altitude exposure. (A) Serum levels of the intestinal permeability tracer FITC-dextran were measured using a fluorescence spectrophotometer (n = 5). (B) Flowchart illustrating the animal treatment protocol. (C) Quantification of F. duncaniae in cecal contents via real-time PCR (n = 3). (D) Body weight changes over the 15-day experimental period (n = 8). Statistically significant differences were observed between the NC and H groups, as well as between the NC and HF groups. (E) Representative histological sections of ileum tissue stained with H&E at 40× and 200× magnification (n = 3). (F) Representative histological sections of ileum tissue stained with PAS at 40× and 200× magnifications (n = 3). (G,H) Immunohistochemical analysis of ZO-1 expression at both 10× and 40× magnifications (n = 3) (G) and occludin expression at the same magnifications (n = 3) (H). (I) Representative images of TUNEL staining in ileal tissues at both 10× and 40× magnifications (n = 3). (J) Measurement of villus height in the ileum using IMAGEJ (n = 3). (K) Measurement of crypt depth in the ileum using IMAGEJ (n = 3). (L) Quantification of goblet cell numbers in the ileum using IMAGEJ (n = 3). (M,N) Percentage of positive area for ZO-1 (M) and occludin (N) (n = 3). (O) Percentage of positive cells in TUNEL-stained ileal tissues (n = 3). (P) Serum levels of the intestinal permeability tracer FITC-dextran were measured using a fluorescence spectrophotometer (n = 5). Statistical analysis was conducted using one-way ANOVA (A,C,D,JP). * p < 0.05, ** p < 0.01, *** p < 0.001. Data are presented as means ± SD.
Figure 3
Figure 3
Influence of F. duncaniae on the metabolome of cecal contents. (A,B) PLS-DA analysis was performed to compare the NC and H groups (A), as well as between the H and HF groups (n = 6) (B). (C,D) Volcano plots illustrate the differential metabolites between the H and NC groups (C) and between the HF and H groups (n = 6) (D). (E,F) VIP score analysis, based on the weighted coefficients of the OPLS-DA model, ranks the contributions of metabolites to the differentiation between the NC and H groups (E), as well as between the H and HF groups (n = 6) (F). (G) KEGG pathway enrichment analysis was conducted using the differential metabolites identified between the NC and H groups (n = 6). (HK) The abundances of differential metabolites associated with the HIF-1 signaling pathway were evaluated between the NC and H groups (n = 6). (L) The quantification of 2-ketoglutaric acid was performed at a total protein concentration of 1 g/L of the cecal contents across different groups (n = 8). (M) The activity of AST in the cecal contents was measured across various groups (n = 8). (N) The activity of IDH at a total protein concentration of 1 g/L of the cecal contents was analyzed across different groups (n = 8). Statistical analyses were performed using Student’s t-test (HN). Significance levels were defined as follows: * p < 0.05, ** p < 0.01, *** p < 0.001, and “ns” indicates no significance.
Figure 4
Figure 4
Influence of F. duncaniae on the transcriptome of ileal tissues. (A,B) Volcano plots depict the differentially expressed genes (DEGs) between the NC and H groups (A), as well as between the HF and H groups (n = 4) (B). (C,D) GO pathway enrichment analyses were performed using the DEGs from the comparisons of the NC and H groups (C) and the HF and H groups (n = 4) (D). (E,F) KEGG pathway enrichment analyses were conducted for the DEGs in both the NC versus H groups (E) and HF versus H groups (n = 4) (F). (G) Heat maps illustrate the DEGs associated with the Apoptosis and Calcium Signaling Pathways (n = 4). (H,I) RT-qPCR validation of the expression levels of Nfkbia and Fos (n = 4) was carried out. Statistical analyses were performed using one-way ANOVA (H,I), with significance levels defined as follows: * p < 0.05, and “ns” indicates no significance.
Figure 5
Figure 5
2-Ketoglutaric acid helps to repair intestinal barrier damage in mice resulting from high-altitude exposure. (A) Flowchart illustrating the animal treatment protocol. (B) Body weight changes over the 15-day experimental period (n = 8). Statistically significant differences were observed between the NC and H groups, as well as between the NC and H2K groups. (C) Measurement of villus height in the ileum using IMAGEJ (n = 5). (D) Representative histological sections of ileum tissue stained with H&E at 40× and 200× magnifications (n = 5). (E) Representative histological sections of ileum tissue stained with PAS at 40× and 200× magnifications (n = 5). (F) Immunohistochemical analysis of occludin expression at both 10× and 40× magnifications (n = 3). (G) Representative images of TUNEL staining in ileal tissues at both 10× and 40× magnifications (n = 3). (H) Measurement of crypt depth in the ileum using IMAGEJ (n = 5). (I) Quantification of goblet cell numbers in the ileum using IMAGEJ (n = 5). (J) Percentage of positive area for occludin (n = 3). (K) Percentage of positive cells in TUNEL-stained ileal tissues (n = 3). (L) Serum levels of the intestinal permeability tracer FITC-dextran were measured using a fluorescence spectrophotometer (n = 5). Statistical analysis was conducted using one-way ANOVA (B,C,HL). * p < 0.05, ** p < 0.01, *** p < 0.001, and “ns” indicates no significance. Data are presented as means ± SD.

Similar articles

References

    1. McKenna Z.J., Pereira F.G., Gillum T.L., Amorim F.T., Deyhle M.R., Mermier C.M. High-altitude exposures and intestinal barrier dysfunction. Am. J. Physiol. Regul. Integr. Comp. Physiol. 2022;322:R192–R203. doi: 10.1152/ajpregu.00270.2021. - DOI - PubMed
    1. Chen Y., Tang X., Zeng X., Han B., Xie H., Wang W., Sun L., Hu M., Gao Y., Xiao W. Gastrointestinal syndrome encountered during a train voyage to high altitudes: A 14-day survey of 69 passengers in China. Travel. Med. Infect. Dis. 2024;59:102718. doi: 10.1016/j.tmaid.2024.102718. - DOI - PubMed
    1. Xie H., Zeng X.G., Wang W.G., Wang W., Han B., Tan Q., Hu Q., Liu X., Chen S., Chen J., et al. Enteric glial cells aggravate the intestinal epithelial barrier damage by secreting S100β under high-altitude conditions. Mol. Biomed. 2023;4:31. doi: 10.1186/s43556-023-00143-1. - DOI - PMC - PubMed
    1. Feng L., Chen S., Zhang L., Qu W., Chen Z. Bisphenol A increases intestinal permeability through disrupting intestinal barrier function in mice. Env. Pollut. 2019;254:112960. doi: 10.1016/j.envpol.2019.112960. - DOI - PubMed
    1. Liu D., Chen D., Xiao J., Wang W., Zhang L., Peng H., Han C., Yao H. High-altitude-induced alterations in intestinal microbiota. Front. Microbiol. 2024;15:1369627. doi: 10.3389/fmicb.2024.1369627. - DOI - PMC - PubMed

LinkOut - more resources