Review
. 2025 Apr 9;17(8):1016.
doi: 10.3390/polym17081016.

Polyvinyl Alcohol-Based Membranes: A Review of Research Progress on Design and Predictive Modeling of Properties for Targeted Application

Affiliations
Review

Polyvinyl Alcohol-Based Membranes: A Review of Research Progress on Design and Predictive Modeling of Properties for Targeted Application

Anca Filimon et al. Polymers (Basel). .

Abstract

This review provides a comprehensive evaluation of the current state of polyvinyl alcohol (PVA)-based membranes, emphasizing their significance in membrane technology for various applications. The analysis encompasses both experimental and theoretical research articles, with a focus on recent decades, aiming to elucidate the potential and limitations of different fabrication approaches, structure-property relationships, and their applicability in the real world. The review begins by examining the advanced polymeric materials and strategies employed in the design and processing of membranes with tailored properties. Fundamental principles of membrane processes are introduced, with a focus on general modeling approaches for describing the fluid transport through membranes. A key aspect of discussion is the distinction between the membrane performance and process performance. Additionally, an in-depth analysis of PVA membranes in various applications is presented, particularly in environmental fields (e.g., fuel cell, water treatment, air purification, and food packaging) and biomedical domains (e.g., drug delivery systems, wound healing, tissue engineering and regenerative medicine, hemodialysis and artificial organs, and ophthalmic and periodontal treatment). Special attention is given to the relationship between membranes' characteristics, such as material composition, structure, and processing parameters, and their overall performance, in terms of permeability, selectivity, and stability. Despite their promising properties, enhanced through innovative fabrication methods that expand their applicability, challenges remain in optimizing long-term stability, improving fouling resistance, and increasing process scalability. Therefore, further research is needed to develop novel modifications and composite structures that overcome these limitations and enhance the practical implementation of PVA-based membranes. By offering a systematic overview, this review aims to advance the understanding of PVA membrane fabrication, properties, and functionality, providing valuable insights for continued development and optimization in membrane technology.

Keywords: biomedical fields; environmental applications; manufacturing membranes; polyvinyl alcohol; thermodynamic modeling.


Conflict of interest statement

The authors declare no conflicts of interest.

Figures

Figure 1
Figure 1
Schematic representation of the PVA-based membrane applications.
Figure 2
Figure 2
(a) Phase diagram: temperature versus composition for a binary polymer blend (LCST—lower critical solution temperature; UCST—upper critical solution temperature). (b) Schematic representation of phase-separation mechanisms in polymer solutions: phase separation occurs via the formation of small, isolated spherical regions of the second phase, which grow over time (nucleation and growth); phase separation leads to interconnected, worm-like structures that evolve into coarsened spheroidal domains (spinodal decomposition). Adapted with permission from [44].
Figure 3
Figure 3
Phase diagram of PVA/water solution showing the pathways leading to the formation of dense and porous membranes as a result of the crosslinking reaction in the diphasic region and the effect of temperature and catalyst on the membrane structure. Adapted with permission from [47].
Figure 4
Figure 4
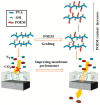
The method to obtain permeable PVA-g-POEM membranes with improved performance in gas-separation processes, using the grafting technique (graft copolymer consisting of PVA main chains and poly(oxyethylene methacrylate) (POEM) side chains). Adapted with permission from [91].
Figure 5
Figure 5
Thermodynamic regions illustrated in phase diagram for a ternary system and the dynamic evolution of compositions, using the Gibbs free energy equation, which finally results in different morphologies and internal structure of membranes. Adapted with permission from [106].
Figure 6
Figure 6
Schematic diagram illustrating the fabrication of a porous poly(vinyl alcohol) matrix as a functional model of the lung epithelial system: SEM images and porosity of the matrix as a function of the PVA solution concentration; theoretical polarity of the cosolvent mixtures. Adapted with permission from [115].
Figure 7
Figure 7
Schematic representation of steps taken towards creating an alternative platform for removing tumor cells before they are returned to the patient: obtaining nonwoven membranes by electrospinning (wire-based needleless DC electrospinning and AC electrospinning with a rod-like electrode and rotating drum collector) and heat treatment at 180 °C, using PVA 98% and 99% hydrolyzed. SEM images are shown of electrospun PVA membranes with 98% and 99% DH, obtained by DC electrospinning, designed for use in the cell salvage process. Adapted with permission from [138].
Figure 8
Figure 8
Effect of ethanol/CO2 ratio and polymer solution concentration on the morphology of PVA membranes. Adapted with permission from [141].
Figure 9
Figure 9
SEM images of SPEEK/PVA/GO-NF membranes (a) mechanical properties (b) proton conductivity and phase angle on frequency (c) for SPEEK/PVA-GO and SPEEK/PVA-GO-NF composite membranes at different temperatures. Adapted with permission from [146].
Figure 10
Figure 10
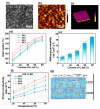
(a) TEM images, (b,c) 2D and 3D AFM phase diagram of CPVA/PIL-20 membrane, (d) water uptake, (e) methanol permeability, (f) proton conductivity, and (g) schematic diagram of the proton conduction mechanism of CPVA/PILs membranes. Adapted with permission from [149].
Figure 11
Figure 11
SEM images of membranes obtained by electrospinning of PVA solution of 10 wt.% (a), pore size distribution (b), water flux through the membrane (c), and rejection of polycarboxylate microspheres (d) for the electrospun PVA membranes of different thicknesses and Millipore GSWP 0.22 μm. Adapted with permission from [158].
Figure 12
Figure 12
Two-dimensional AFM and SEM cross-section of PE-PVA88 and PE-PVA99 membranes (a), pore size distribution (b), water permeability (c), and dye rejection capacity (d) of PE-PVA membranes. Adapted with permission from [167].
Figure 13
Figure 13
SEM images of the surface and cross-section of PVDF and CPVA/PVDF membranes (a), the permeate flux, rejection efficiency, and porosity of PVDF and CPVA/PVDF membranes (b), change in irreversible fouling (Rir), reversible fouling (Rr), total fouling (Rt), and fouling recovery rate (FRR) (c), and schematic representation of the efficiency of Cu(II) and bovine serum albumin (BSA) removal rate of PVDF and CPVA/PVDF membranes (d). Adapted with permission from [170].
Figure 14
Figure 14
SEM images of the PVA/CA membranes without (a) and containing ZrO2 NPs (b), the separation processes performance (c), and the fouling resistance (d) of PVA/CA RO membranes. Adapted with permission from [172].
Figure 15
Figure 15
SEM images of the PVA-Eo membrane with the corresponding profile of the fiber diameter distribution (a), EC-Eo membrane with a small graph representing the particle diameter distribution (b), and filtration efficiency of PMx (c,d). Adapted with permission from [192].
Figure 16
Figure 16
SEM images of CMC/PVA film containing 0.9% CuO with small graph inserted for CuO-NPs (a), the biodegradation process of CMC/PVA/CuO-NPs with different content of CuO-NPs (b), and the impact of CMC/PVA coatings on cheese after 6 months of cold storage (c). Adapted with permission from [211].
Figure 17
Figure 17
SEM images and the diameter distribution of pure PVA nanofibers obtained from solutions with concentrations of 6 wt.% (a,a’), 7 wt.% (b,b’), 8 wt.% (c,c’), and 9 wt.% (d,d’). The figure also includes SEM images of the PHA/PVA composite membranes corresponding to the 6 wt.% (a’’), 7 wt.% (b’’), 8 wt.% (c’’), and 9 wt.% (d’’) PVA solutions Adapted with permission from [218].
Figure 18
Figure 18
The schematic illustration includes SEM images and the distribution of fiber diameters (a), TEM images (b), FTIR spectra (c), EDS mapping (d), and the elemental composition of Xyl-PVA/DA-Ag nanofiber mats as determined by EDS (e). Additionally, it presents the contact angles (f) and tensile strength (g) of both Xyl-PVA and Xyl-PVA/DA-Ag nanofiber mats. Adapted with permission from [238].
Figure 19
Figure 19
SEM images of electrospun nanofibers obtained from 4% calcium alginate and 7% PVA solutions in different volume ratios Adapted with permission from [257].
Figure 20
Figure 20
Schematic representation showing the examination of PVA–alginate nanofiber matrix in vivo studies on wound healing: (a,c,e) control wounds, and (b,d,f) test wounds Adapted with permission from [257].
Figure 21
Figure 21
A schematic illustration of applications in tissue engineering. Adapted with permission from [30].
Figure 22
Figure 22
Schematic representation showing modified electrospinning method incorporating PLCL nanofibers, PVA aerogel, and melatonin. Adapted with permission from [260].
Figure 23
Figure 23
SEM images (ad) together with respective histograms that depict the diameter distribution (a’d’) for nanofibrous scaffolds. The nanofiber categories represented include PVA (a,a’), PVA90/EX10 (b,b’), PVA80/EX20 (c,c’), and PVA70/EX30 (d,d’). Adapted with permission from [220].
Figure 24
Figure 24
SEM images depicting the bone samples collected four weeks following the surgery. Adapted with permission from [266].
Figure 25
Figure 25
Schematic illustration of hemodialysis system. Adapted with permission from [276].

Similar articles

References

    1. Luis P. Chapter 1—Introduction. In: Luis P., editor. Fundamental Modelling of Membrane Systems. Elsevier; Amsterdam, The Netherlands: 2018. pp. 1–23.
    1. Hahn-Hägerdal B., Galbe M., Gorwa-Grauslund M.F., Lidén G., Zacchi G. Bio-ethanol—The fuel of tomorrow from the residues of today. Trends Biotechnol. 2006;24:549–556. doi: 10.1016/j.tibtech.2006.10.004. - DOI - PubMed
    1. Farrell A.E., Plevin R.J., Turner B.T., Jones A.D., O’Hare M., Kammen D.M. Ethanol Can Contribute to Energy and Environmental Goals. Science. 2006;311:506–508. doi: 10.1126/science.1121416. - DOI - PubMed
    1. Dautzenberg F.M., Mukherjee M. Process intensification using multifunctional reactors. Chem. Eng. Sci. 2001;56:251–267. doi: 10.1016/S0009-2509(00)00228-1. - DOI
    1. Fried J.R. Basic Principles of Membrane Technology By Marcel Mulder (University of Twente, The Netherlands). Kluwer Academic: Dordrecht. 1996. 564 pp. $255.00. ISBN 0-7823-4247-X. J. Am. Chem. Soc. 1997;119:8582. doi: 10.1021/ja975504k. - DOI

LinkOut - more resources