. 2025 Apr 1;17(4):454.
doi: 10.3390/pharmaceutics17040454.

Microfluidic Optimization of PEI-Lipid Hybrid Nanoparticles for Efficient DNA Delivery and Transgene Expression

Affiliations

Microfluidic Optimization of PEI-Lipid Hybrid Nanoparticles for Efficient DNA Delivery and Transgene Expression

Mahboubeh Hosseini-Kharat et al. Pharmaceutics. .

Abstract

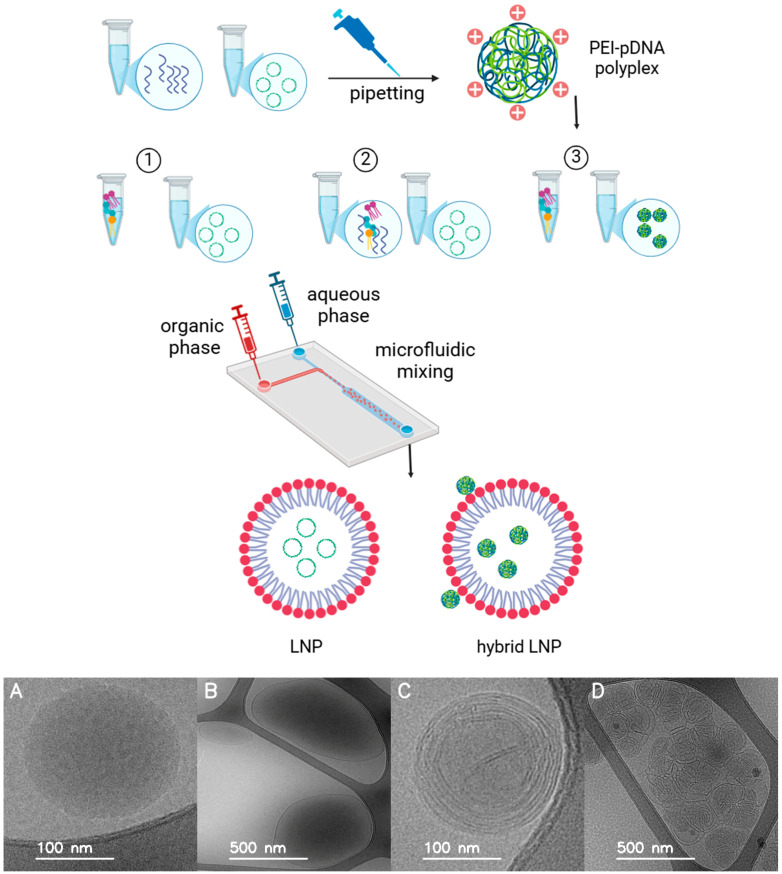
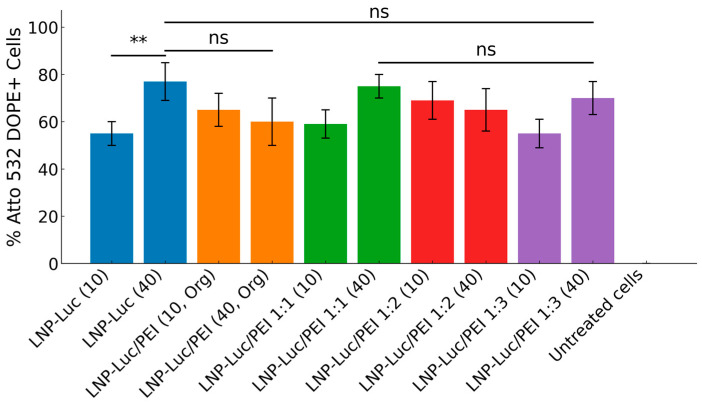
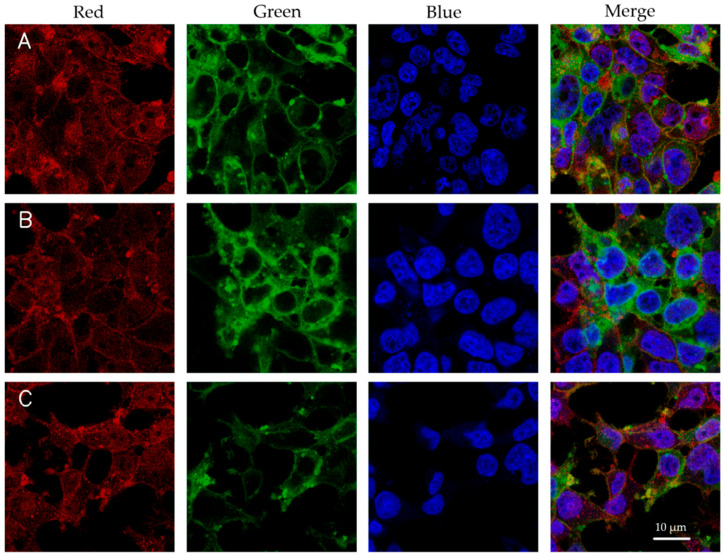
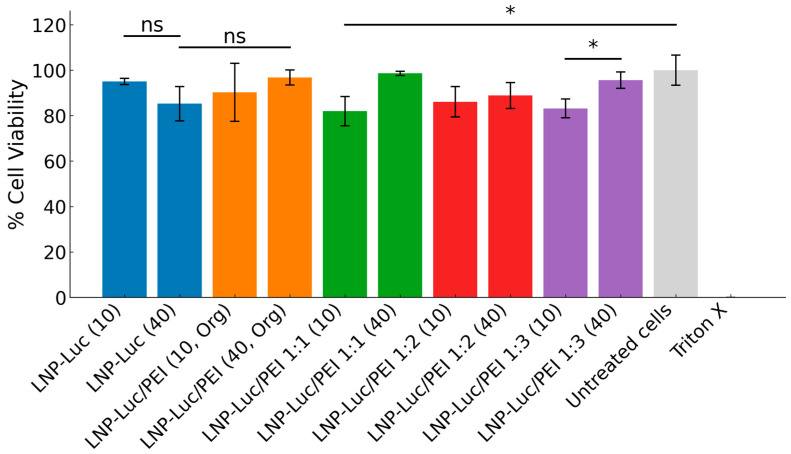
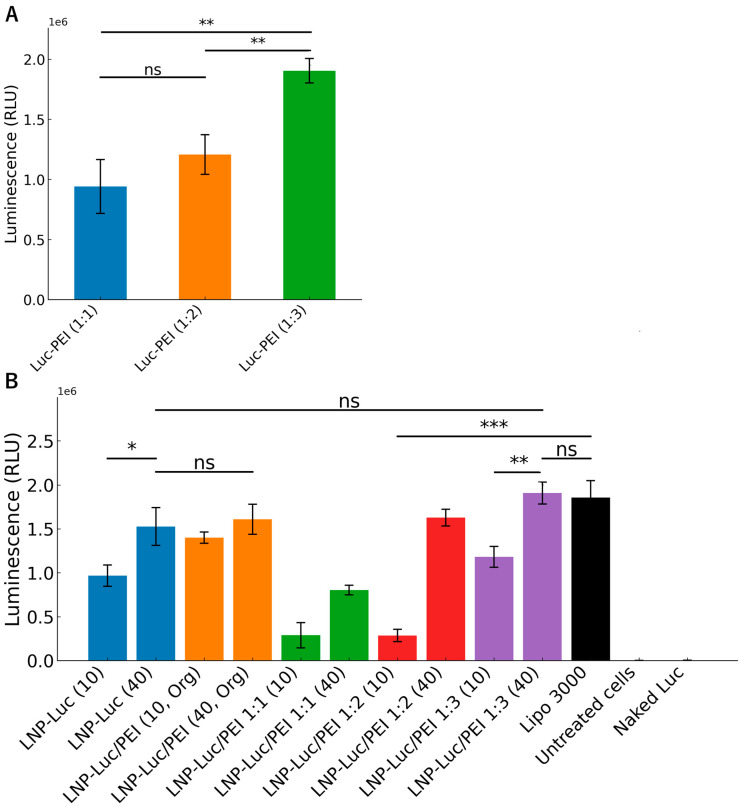
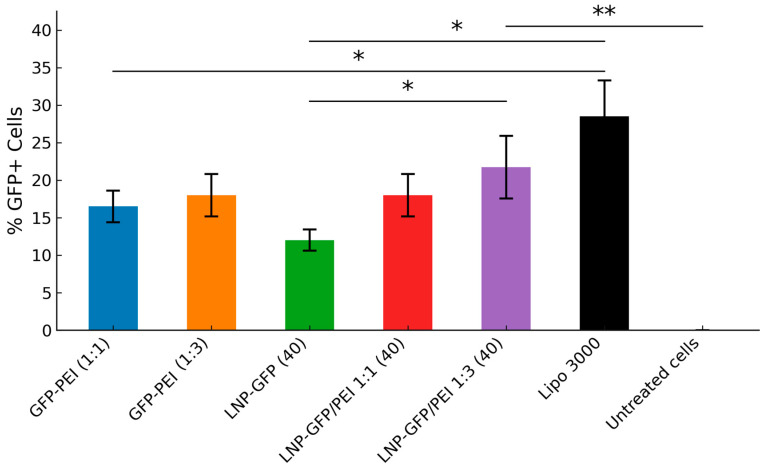
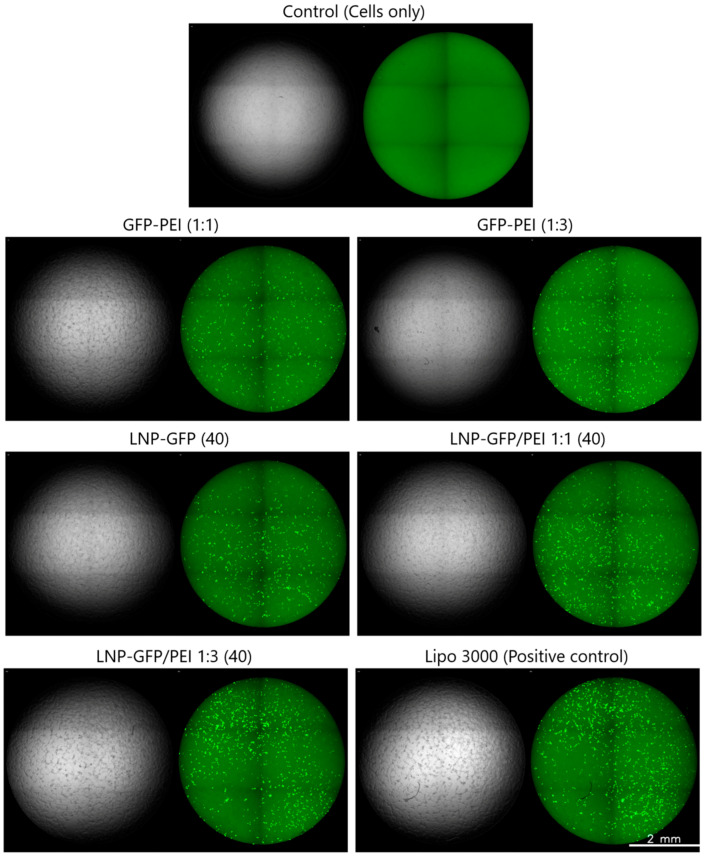
Background: Lipid nanoparticles (LNPs) and polyethyleneimine (PEI) have independently been used for DNA complexation and delivery. However, non-ideal gene delivery efficiency and toxicity have hindered their clinical translation. We developed DNA-PEI-LNPs as a strategy to overcome these limitations and enhance DNA delivery and transgene expression. Methods: Three microfluidic mixing protocols were evaluated: (i) LNPs without PEI, (ii) a single-step process incorporating PEI in the organic phase, and (iii) a two-step process with DNA pre-complexed with PEI before LNP incorporation. The influence of DNA/PEI ratios (1:1, 1:2, 1:3) and DNA/lipid ratios (1:10, 1:40) on particle properties and delivery efficiency was examined. Results: In luciferase formulations, higher DNA/lipid ratios (1:40) produced smaller particles (136 nm vs. 188 nm) with improved cellular uptake (77% vs. 50%). The two-step method with higher DNA/PEI ratios improved transfection efficiency, with LNP-Luc/PEI 1:3 (40) achieving ~1.9 × 10⁶ relative light units (RLU) in luciferase expression. In green fluorescent protein (GFP) studies, LNP-GFP/PEI 1:3 (40) showed ~23.8% GFP-positive cells, nearly twofold higher than LNP-GFP (40) at ~12.6%. Conclusions: These results demonstrate the capability of microfluidic-prepared DNA-PEI-LNPs to improve DNA delivery and transgene expression through optimized formulation strategies and selection of appropriate preparation methods.

Keywords: DNA delivery; GFP expression; gene therapy; lipid nanoparticles (LNPs); lipid-polymer hybrid systems; luciferase assays; microfluidic mixing; polyethyleneimine (PEI); transgene expression.


Conflict of interest statement

The authors declare no conflicts of interest.

Figures

Figure 1
Figure 1
Top: Schematic representation of LNP and hybrid LNP-PEI preparation using microfluidic mixing. (1) LNPs: DNA and lipids are mixed directly. (2) One-step hybrid LNP-PEI: PEI is added to the organic phase. (3) Two-step hybrid LNP-PEI: DNA is pre-complexed with PEI before mixing with lipids. Colour scheme: green circular, coiled structures indicate pDNA, blue strands represent PEI, and red circles represent lipid head groups (outer surface). Created with BioRender.com. Bottom (Supplementary Materials Figure S1): Cryo-TEM images of representative LNP formulations showing structural variations: (A) LNP-Luc (40), (B,C) LNP-Luc/PEI (40, Org), with (C) displaying onion-like multilamellar structure, and (D) LNP-Luc/PEI 1:3 (40), also showing multilamellar structures.
Figure 2
Figure 2
Cellular uptake of ATTO 532 DOPE-tagged formulations in HEK 293 cells after 4 h of incubation with 0.2 µg DNA per formulation, assessed by flow cytometry. Data show the mean ± standard deviation (SD) of three independent measurements. Statistical significance was determined using unpaired two-tailed t-tests for comparisons between two groups and one-way ANOVA for comparisons among three or more groups. Results are indicated as follows: ns (p > 0.05), ** (p < 0.01). Asterisks and “ns” annotations on the graph denote the significance of pairwise comparisons.
Figure 3
Figure 3
Confocal microscopy images of HEK 293 cells incubated for 4 h with ATTO 532 DOPE-tagged formulations (containing 0.5 µg DNA per treatment). DAPI was used to stain the nucleus (blue), and Alexa Fluor 633-WGA dye was used to label the cell membrane (red). (A) LNP-Luc (40), (B) LNP-Luc/PEI 1:2 (40), and (C) LNP-Luc/PEI (10, Org). The green fluorescence signal corresponds to ATTO 532 DOPE-labelled nanoparticles, indicating cellular uptake. Scale bar: 10 µm.
Figure 4
Figure 4
Cell viability of HEK 293 cells treated with various formulations (MTT assay). Untreated cells served as the control (100% viability). Triton X was used as a positive control to confirm complete cell death (0% viability). Statistical significance was determined using unpaired two-tailed t-tests for comparisons between two groups and one-way ANOVA for comparisons among three or more groups. Results are indicated as follows: ns (p > 0.05) and * (p < 0.05). Asterisks on the graph denote significant differences between groups.
Figure 5
Figure 5
(A) Luciferase expression of precomplexed Luc-PEI formulations with different DNA/PEI ratios (1:1, 1:2, 1:3), measured as luminescence intensity (RLU) in HEK 293 cells. (B) Luminescence intensity (RLU) of various lipid-based formulations in HEK 293 cells after 48 h of incubation with a DNA dose of 0.2 µg. Error bars represent the standard deviation from three independent replicates. Statistical significance was determined using unpaired two-tailed t-tests for comparisons between two groups and one-way ANOVA for comparisons among three or more groups. Results are indicated as follows: ns (p > 0.05), * (p < 0.05), ** (p < 0.01), and *** (p < 0.001). Asterisks on the graph denote significant differences between groups.
Figure 6
Figure 6
Percentage of GFP-Positive Cells in HEK 293 Transfection Study. Bar graph showing the percentage of GFP+ cells measured by flow cytometry after transfection with different DNA-lipid formulations. We transfected HEK 293 cells with 0.2 µg DNA and incubated them for 48 h. Error bars represent the standard deviation from independent replicates. Statistical significance was determined using unpaired two-tailed t-tests for comparisons between two groups and one-way ANOVA for comparisons among three or more groups. Results are indicated as: * (p < 0.05), and ** (p < 0.01). Asterisks denote significant differences between groups.
Figure 7
Figure 7
GFP expression in HEK 293 cells following transfection. Fluorescence microscopy images of HEK 293 cells 48 h post-transfection, with each image showing a bright field (left) and a green fluorescence (right) view side by side. Cells were transfected with lipofectamine 3000 or experimental GFP-based formulations at a dose of 0.2 µg DNA. The control represents untransfected cells (no DNA or transfection agents added).

Similar articles

References

    1. Jensen T.L., Gøtzsche C.R., Woldbye D.P.D. Current and Future Prospects for Gene Therapy for Rare Genetic Diseases Affecting the Brain and Spinal Cord. Front. Mol. Neurosci. 2021;14:695937. doi: 10.3389/fnmol.2021.695937. - DOI - PMC - PubMed
    1. Volodina O., Smirnikhina S. The Future of Gene Therapy: A Review of In Vivo and Ex Vivo Delivery Methods for Genome Editing-Based Therapies. Mol. Biotechnol. 2024;67:425–437. doi: 10.1007/s12033-024-01070-4. - DOI - PubMed
    1. El-Zahaby S.A., Kaur L., Sharma A., Prasad A.G., Wani A.K., Singh R., Zakaria M.Y. Lipoplexes’ Structure, Preparation, and Role in Managing Different Diseases. AAPS PharmSciTech. 2024;25:131. doi: 10.1208/s12249-024-02850-6. - DOI - PubMed
    1. Dogbey D.M., Torres V.E.S., Fajemisin E., Mpondo L., Ngwenya T., Akinrinmade O.A., Perriman A.W., Barth S. Technological advances in the use of viral and non-viral vectors for delivering genetic and non-genetic cargos for cancer therapy. Drug Deliv. Transl. Res. 2023;13:2719–2738. doi: 10.1007/s13346-023-01362-3. - DOI - PMC - PubMed
    1. Zu H., Gao D. Non-viral Vectors in Gene Therapy: Recent Development, Challenges, and Prospects. AAPS J. 2021;23:78. doi: 10.1208/s12248-021-00608-7. - DOI - PMC - PubMed

LinkOut - more resources