

Mechanistic Insights into Sphingomyelin Nanoemulsions as Drug Delivery Systems for Non-Small Cell Lung Cancer Therapy
- PMID: 40284457
- PMCID: PMC12030345
- DOI: 10.3390/pharmaceutics17040461
Mechanistic Insights into Sphingomyelin Nanoemulsions as Drug Delivery Systems for Non-Small Cell Lung Cancer Therapy
Abstract
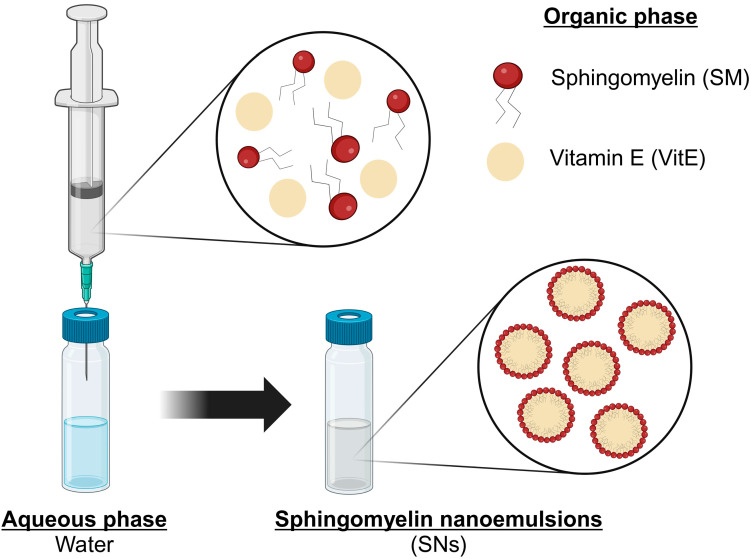
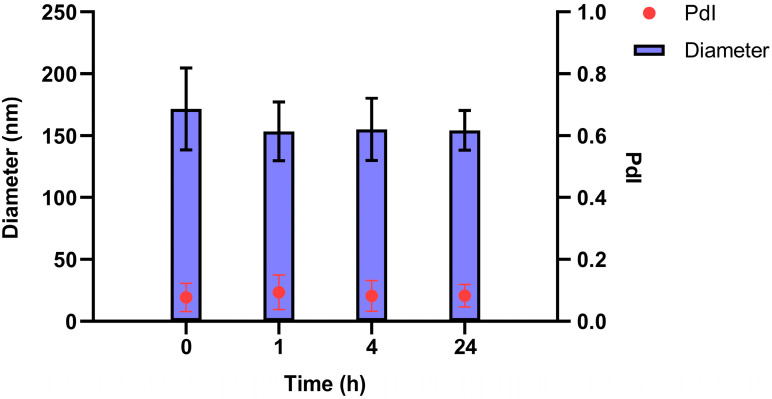
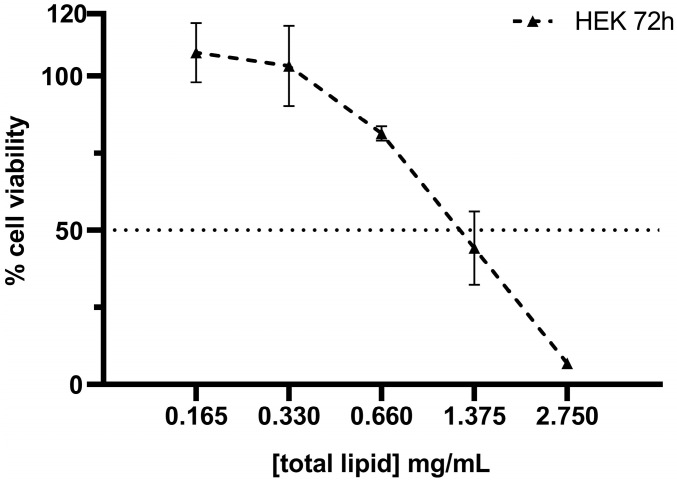
Sphingomyelin nanoemulsions (SNs) are promising drug delivery systems with potential for treating challenging tumors, including non-small cell lung cancer (NSCLC), which has a poor prognosis and a 5-year survival rate below 5%. Understanding the toxicity mechanisms and intracellular behavior of SNs is crucial for optimizing their therapeutic application. This study aims to investigate the interaction between SNs and A549 lung adenocarcinoma cells, focusing on their cytotoxic effects and mechanisms of cellular toxicity. SNs were synthesized and characterized for size, surface charge, and stability. A549 cells were treated with varying concentrations of SNs, and cellular uptake pathways were assessed using inhibitors of energy-dependent processes. Cytotoxicity was evaluated through an alamarBlue assay to determine the IC50 value after 24 h. Mechanisms of toxicity, including lysosomal and mitochondrial involvement, were examined using co-localization studies, mitochondrial membrane potential assays, and markers of apoptosis. SNs exhibited rapid cellular uptake via energy-dependent pathways. The IC50 concentration for A549 cells was 0.89 ± 0.15 mg/mL, suggesting favorable cytocompatibility compared to other nanocarriers. At IC50, SNs induced apoptosis characterized by lysosomal damage, mitochondrial membrane permeabilization, and the release of apoptotic factors. These effects disrupted autophagic flux and contributed to cell death, demonstrating potential for overcoming drug resistance. Resveratrol-loaded SNs showed enhanced cytotoxicity, supporting their application as targeted drug delivery vehicles. This study highlights the potential of SNs as efficient drug delivery systems for NSCLC therapy, offering insights into their cellular interactions and toxicity mechanisms. These findings pave the way for the rational design of SN-based therapeutic platforms for cancer and other mitochondria-related diseases.
Keywords: drug delivery; lysosomal escape; mitochondrial targeting; non-small cell lung cancer (NSCLC); sphingomyelin nanosystems; targeted cancer therapy.
Conflict of interest statement
M.D.L.F. is the co-founder and CEO of DIVERSA Technologies SL. Author I.M-J was employed by the company DIVERSA Technologies SL. Both authors are affiliated with the company DIVERSA but have no potential conflict of interest relationship. The remaining authors declare that the research was conducted in the absence of any commercial or financial relationships that could be construed as a potential conflict of interest.
Figures


Similar articles
-
Baicalin induces cell death of non-small cell lung cancer cells via MCOLN3-mediated lysosomal dysfunction and autophagy blockage.Phytomedicine. 2024 Oct;133:155872. doi: 10.1016/j.phymed.2024.155872. Epub 2024 Jul 20. Phytomedicine. 2024. PMID: 39096542
-
Sphingomyelin nanosystems decorated with TSP-1 derived peptide targeting senescent cells.Int J Pharm. 2022 Apr 5;617:121618. doi: 10.1016/j.ijpharm.2022.121618. Epub 2022 Feb 24. Int J Pharm. 2022. PMID: 35219823
-
Nanotechnology Based Repositioning of an Anti-Viral Drug for Non-Small Cell Lung Cancer (NSCLC).Pharm Res. 2020 Jun 8;37(7):123. doi: 10.1007/s11095-020-02848-2. Pharm Res. 2020. PMID: 32514688
-
The small-molecule CDK inhibitor, SNS-032, enhances cellular radiosensitivity in quiescent and hypoxic non-small cell lung cancer cells.Lung Cancer. 2009 Oct;66(1):37-47. doi: 10.1016/j.lungcan.2008.12.026. Epub 2009 Feb 3. Lung Cancer. 2009. PMID: 19193471
-
Carbon Nanotubes as Carriers in Drug Delivery for Non-Small Cell Lung Cancer, Mechanistic Analysis of Their Carcinogenic Potential, Safety Profiling and Identification of Biomarkers.Int J Nanomedicine. 2022 Dec 8;17:6157-6180. doi: 10.2147/IJN.S384592. eCollection 2022. Int J Nanomedicine. 2022. PMID: 36523423 Free PMC article. Review.
References
-
- Palazzolo S., Bayda S., Hadla M., Caligiuri I., Corona G., Toffoli G., Rizzolio F. The Clinical Translation of Organic Nanomaterials for Cancer Therapy: A Focus on Polymeric Nanoparticles, Micelles, Liposomes and Exosomes. Curr. Med. Chem. 2018;25:4224–4268. - PubMed
Grants and funding
- GPC IN607B2024/14/Xunta de Galicia by Grupos de Potencial Crecemento, Axencia Galega de Innovación (GAIN), Consellería de Economía, Emprego e Industria
- RTC2019-07227-1/Ministry of Economy and Competitiveness, Spain), co-financed by the European De-velopment Regional Fund ''A way to achieve Europe''
- PI21/01262/Instituto de Salud Carlos III, ISCIII
- Ayudas Predoctorales AECC 2023 A Coruña/Asociación Española Contra el Cáncer
LinkOut - more resources
Full Text Sources
