

Evaluation and Application of the MIRA-qPCR Method for Rapid Detection of Norovirus Genogroup II in Shellfish
- PMID: 40284551
- PMCID: PMC12029516
- DOI: 10.3390/microorganisms13040712
Evaluation and Application of the MIRA-qPCR Method for Rapid Detection of Norovirus Genogroup II in Shellfish
Abstract
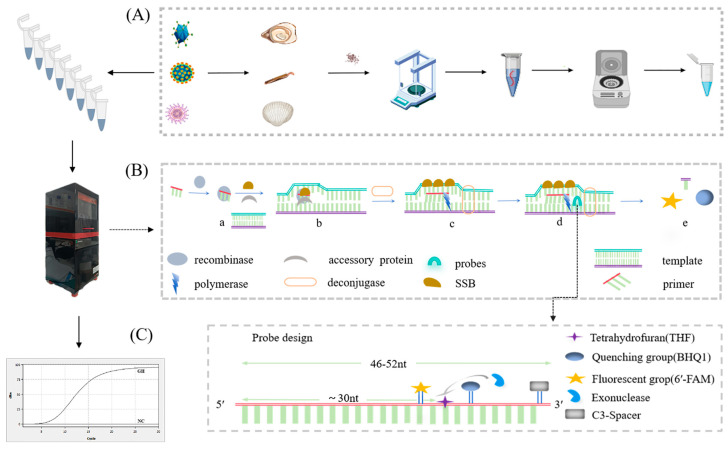
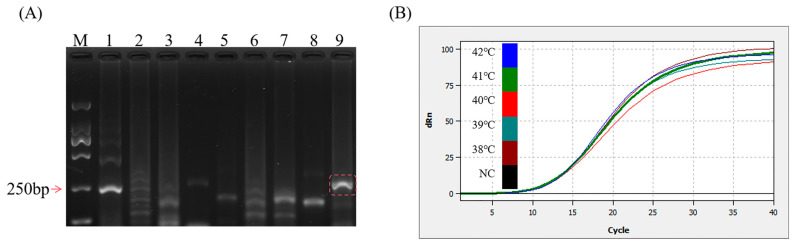
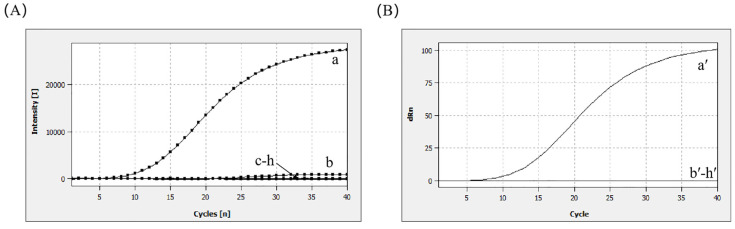
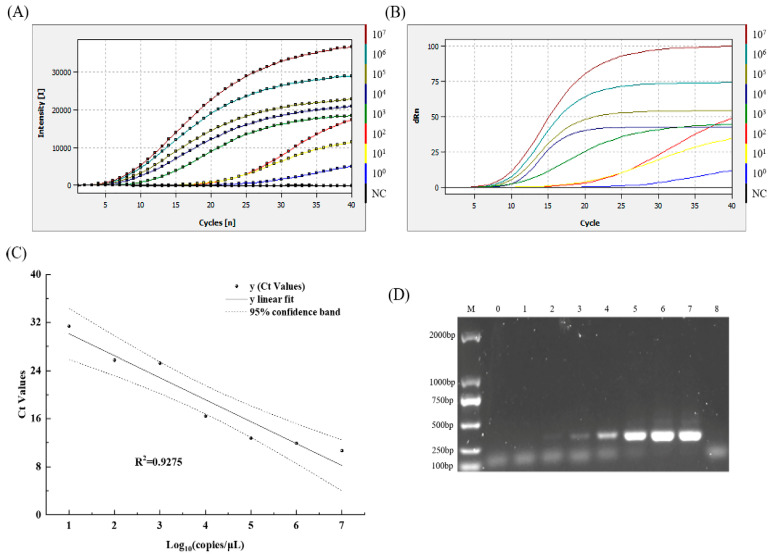
Globally, norovirus has become the primary cause of outbreaks of acute gastroenteritis, and an increasing number of norovirus GII infections have been associated with shellfish. This highlights the urgent need to establish sensitive and rapid detection platforms for timely screening of contaminated shellfish to reduce the risk of virus transmission. To address this challenge, we developed a novel detection method combining multienzyme isothermal rapid amplification (MIRA) with qPCR, referred to as MIRA-qPCR, specifically targeting norovirus GII. It exhibited robust specificity, demonstrating no cross-reactivity with sapovirus, rotavirus, hepatitis A virus, Escherichia coli, Listeria monocytogenes, or Vibrio parahaemolyticus, and exhibited high sensitivity, detecting as low as 1.62 copies/μL for recombinant plasmid standards. Furthermore, MIRA-qPCR showed good linearity in the 1.62 × 101 to 1.62 × 10⁷ copies/μL range, with an R2 > 0.90. MIRA-qPCR and qPCR assays were performed on 125 fresh shellfish samples; there was good consistency in the detection results, and the Kappa value was 0.90 (p < 0.001). The sensitivity and specificity of the MIRA-qPCR detection were 100.00% and 97.25%, respectively. The MIRA-qPCR technique provides a viable alternative for the rapid screening of norovirus GII-contaminated shellfish to guarantee food safety.
Keywords: MIRA–qPCR; food safety; norovirus GII; rapid amplification; shellfish.
Conflict of interest statement
The authors declare no conflicts of interest.
Figures
Similar articles
-
Real-Time Reverse Transcription Multienzyme Isothermal Rapid Amplification for Rapid Detection of African Horse Sickness Virus.Transbound Emerg Dis. 2025 Jan 13;2025:1852368. doi: 10.1155/tbed/1852368. eCollection 2025. Transbound Emerg Dis. 2025. PMID: 40302746 Free PMC article.
-
PMAxx-RT-qPCR to Determine Human Norovirus Inactivation Following High-Pressure Processing of Oysters.Food Environ Virol. 2024 Jun;16(2):171-179. doi: 10.1007/s12560-024-09585-4. Epub 2024 Mar 8. Food Environ Virol. 2024. PMID: 38457095
-
Development of two novel on-site detection visualization methods for murine hepatitis virus based on the multienzyme isothermal rapid amplification.Microb Pathog. 2024 Aug;193:106776. doi: 10.1016/j.micpath.2024.106776. Epub 2024 Jul 1. Microb Pathog. 2024. PMID: 38960214
-
Preliminary evaluation of BioFire FilmArray® Gastrointestinal Panel for the detection of noroviruses and other enteric viruses from wastewater and shellfish.Environ Sci Pollut Res Int. 2018 Sep;25(27):27657-27661. doi: 10.1007/s11356-018-2869-2. Epub 2018 Aug 7. Environ Sci Pollut Res Int. 2018. PMID: 30083906
-
Droplet Digital PCR for Precise Quantification of Human Norovirus in Shellfish Associated with Gastroenteritis Illness.J Food Prot. 2024 Nov;87(11):100363. doi: 10.1016/j.jfp.2024.100363. Epub 2024 Sep 18. J Food Prot. 2024. PMID: 39299470
References
-
- Silva A.J., Yang Z., Wolfe J., Hirneisen K.A., Ruelle S.B., Torres A., Williams-Hill D., Kulka M., Hellberg R.S. Application of whole-genome sequencing for norovirus outbreak tracking and surveillance efforts in Orange County, CA. Food Microbiol. 2021;98:103796. doi: 10.1016/j.fm.2021.103796. - DOI - PubMed
Grants and funding
LinkOut - more resources
Full Text Sources
