. 2025 Mar 24;13(4):727.
doi: 10.3390/microorganisms13040727.

Light-Mediated Population Dynamics of Picocyanobacteria Shaping the Diurnal Patterns of Microbial Communities in an Atoll Lagoon

Affiliations

Light-Mediated Population Dynamics of Picocyanobacteria Shaping the Diurnal Patterns of Microbial Communities in an Atoll Lagoon

Ying Yu et al. Microorganisms. .

Abstract

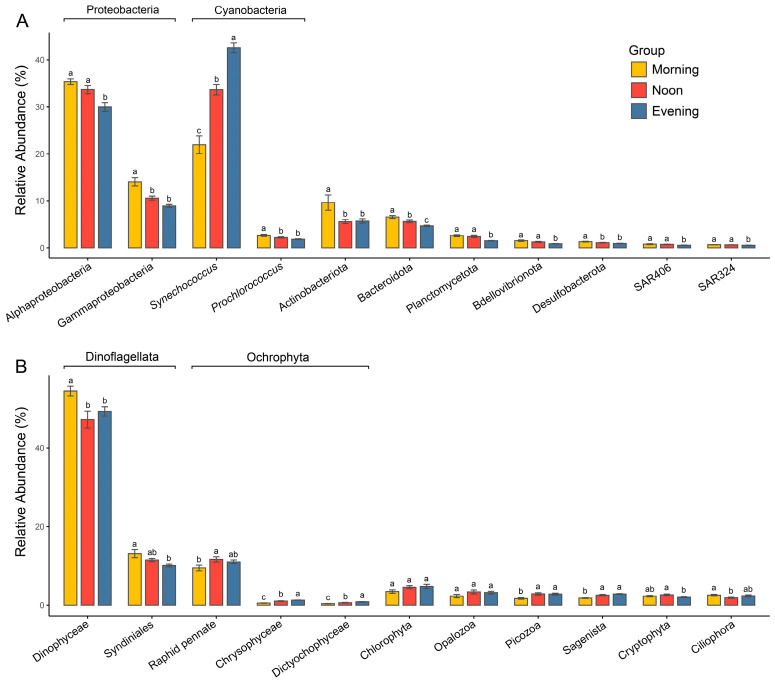
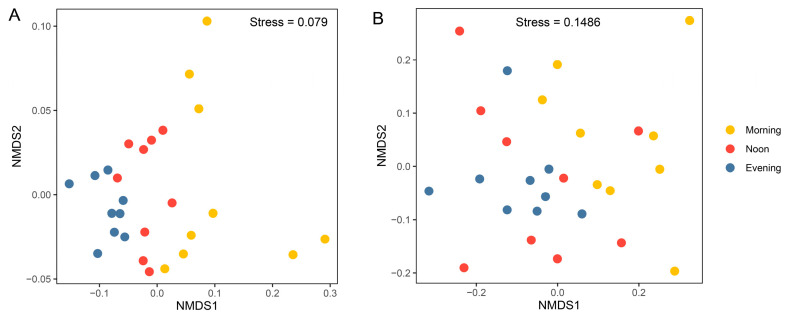
The diurnal cycle of light significantly impacts microbes, making diurnal investigations crucial for understanding microbial communities. Zhubi Reef is known to harbor exceptionally rich biodiversity, with both zooplankton and seawater properties demonstrating diurnal patterns. However, microbial community structures and their potential diurnal dynamics remain largely unexplored. This study is the first to utilize flow cytometry and high-throughput sequencing to investigate prokaryotic and microeukaryotic communities in the Zhubi lagoon, focusing on diurnal variations under different light intensities. The picophytoplankton cell abundance and the microbial community structures both exhibit clear diurnal variations. Light is identified as the primary driver of diurnal variations in the picophytoplankton cell abundance. The diurnal variation in microbial community diversity is driven by changes in the cell abundance of two dominant picocyanobacterial groups. Our findings reveal the diurnal variation in microbial community structures is mediated by the light-driven fluctuation of dominant cyanobacterial populations, and the diurnal variation patterns of specific populations may vary with habitats and sampling timepoints. This research provides valuable insights into the microbial community structure within the Zhubi lagoon.

Keywords: atoll lagoon; diurnal patterns; flow cytometry; high-throughput sequencing; light; microbial community; picocyanobacteria.


Conflict of interest statement

The authors declare no conflicts of interest.

Figures

Figure 1
Figure 1
Location and bathymetric map of the Zhubi Reef. Blue dots indicate the specific sampling sites. Sampling site maps were generated using Ocean Data View version 5.6.3 (http://odv.awi.de, accessed on 15 October 2022). The bathymetric map was sourced from the South China Sea Ocean Data Center.
Figure 2
Figure 2
Cell abundance of picoplankton and its regressions and correlations with environmental variables. Comparison of picoplankton cell abundance among different times (A). Regressions (B) and correlations (C) between cell abundances of picophytoplankton and environmental variables. *, p < 0.05; ***, p < 0.001. The contributions of selected environmental variables were determined using stepwise regression models. Positive correlations between environmental variables and cell abundances are denoted by “+”, while negative correlations are indicated by “−”.
Figure 3
Figure 3
Alpha diversity of microbial communities and environmental factors explaining its variations. Boxplots illustrate the comparison of alpha diversity indices for prokaryotic (A) and microeukaryotic (B) communities among times. Relative contributions of environmental and biotic variables in explaining the variations in alpha diversity indices of prokaryotic (C) and microeukaryotic (D) communities based on stepwise regression models. M, morning; N, noon; E, evening; DSi, dissolved silicate; SRP, soluble reactive phosphate. *, p < 0.05; **, p < 0.01; ***, p < 0.001 (Wilcoxon rank sum test). “•” Indicates greater than 1.5 times of the interquartile range. Positive correlations are denoted by “+”, and negative correlations by “−”.
Figure 4
Figure 4
Comparisons of relative abundances of major prokaryotic (A) and microeukaryotic (B) lineages among different times. Different letters represent significant difference (p < 0.05, one-way ANOVA).
Figure 5
Figure 5
Non-metric multidimensional scaling (NMDS) ordinations of prokaryotic (A) and microeukaryotic (B) communities, based on the Bray–Curtis distance for all samples (n = 27).
Figure 6
Figure 6
Spearman correlations and Mantel test reveal environmental–microbial relationships. The lines connecting environmental variables and microbial communities represent the strength of their relationship. A larger line indicates a stronger relationship. The color of the blocks and the asterisks reflects the relationships between environmental variables. Ab_Syn, cell abundance of Synechococcus; Re_Syn, relative abundance of Synechococcus; Ab_Pro, cell abundance of Prochlorococcus; Re_Pro, relative abundance of Prochlorococcus; Chl a, chlorophyll a concentration; Bac, cell abundance of heterotrophic bacteria; DO, dissolved oxygen; Tide, tidal height; Euk, cell abundance of pico-sized pigmented eukaryotes; Sal, salinity; Temp, temperature. *, p < 0.05; **, p < 0.01; ***, p < 0.001.
Figure 7
Figure 7
The partial least squares path model (PLS-PM) showing the direct and indirect effects of light, Synechococcus, and Prochlorococcus on the alpha diversity (A) and beta diversity (B) of prokaryotic and microeukaryotic communities. The width of the arrow is proportional to the strength of the path coefficient. The red and green arrows indicate the positive and negative flow of causality, respectively (p < 0.05). The number on the arrow indicates the effective normalized path coefficient. R2 represents the variance of the dependent variable explained by the model. Synechococcus, the absolute and relative abundance of Synechococcus; Prochlorococcus, the absolute and relative abundance of Prochlorococcus.

Similar articles

References

    1. Bar-On Y.M., Phillips R., Milo R. The biomass distribution on Earth. Proc. Nat. Acad. Sci. USA. 2018;115:6506–6511. - PMC - PubMed
    1. Hellweger F.L., Jabbur M.L., Johnson C.H., van Sebille E., Sasaki H. Circadian clock helps cyanobacteria manage energy in coastal and high latitude ocean. ISME J. 2020;14:560–568. doi: 10.1038/s41396-019-0547-0. - DOI - PMC - PubMed
    1. Morimoto D., Šulčius S., Tominaga K., Yoshida T. Predetermined clockwork microbial worlds: Current understanding of aquatic microbial diel response from model systems to complex environments. Adv. Appl. Microbiol. 2020;113:163–191. - PubMed
    1. Poretsky R.S., Hewson I., Sun S., Allen A.E., Zehr J.P., Moran M.A. Comparative day/night metatranscriptomic analysis of microbial communities in the North Pacific subtropical gyre. Environ. Microbiol. 2009;11:1358–1375. - PubMed
    1. Welkie D.G., Rubin B.E., Diamond S., Hood R.D., Savage D.F., Golden S.S. A hard day’s night: Cyanobacteria in diel cycles. Trends. Microbiol. 2019;27:231–242. - PMC - PubMed

LinkOut - more resources