

Monthly Variation, Environmental Drivers, and Ecological Functions of Marine Bacterial Community in a Eutrophic Coastal Area of China
- PMID: 40284674
- PMCID: PMC12029234
- DOI: 10.3390/microorganisms13040837
Monthly Variation, Environmental Drivers, and Ecological Functions of Marine Bacterial Community in a Eutrophic Coastal Area of China
Abstract
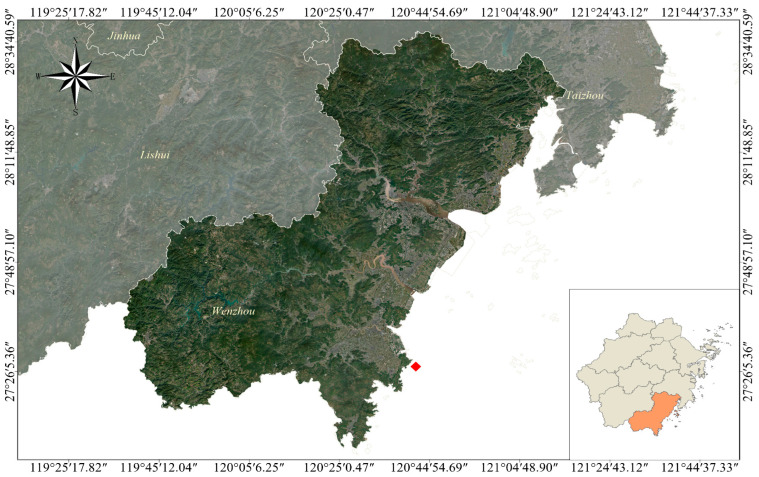
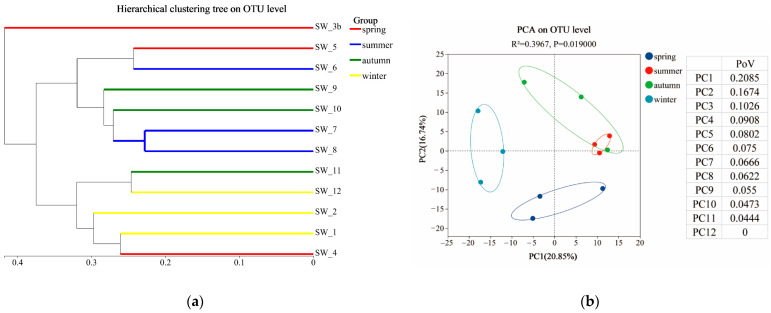
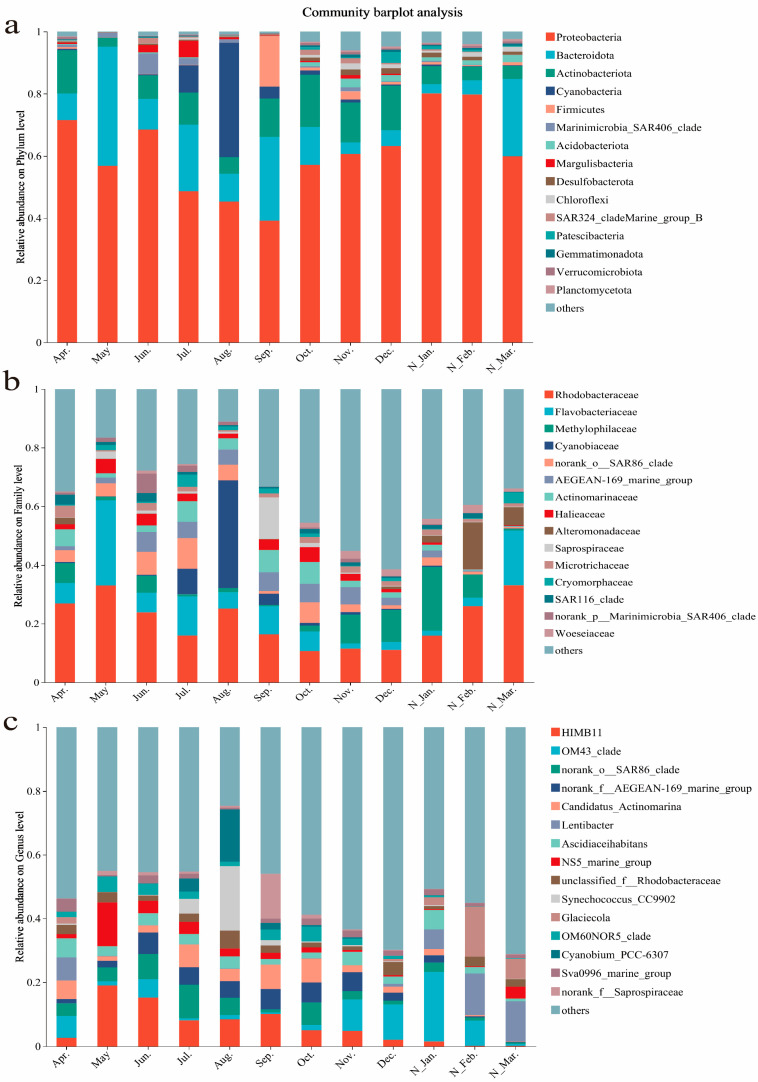
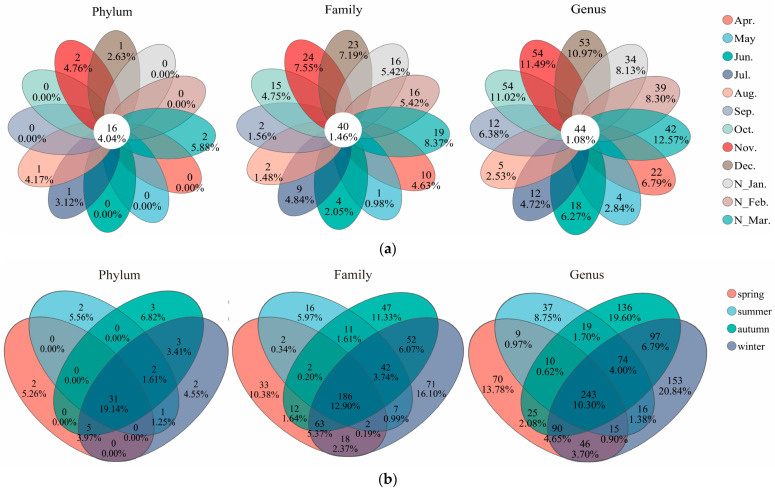
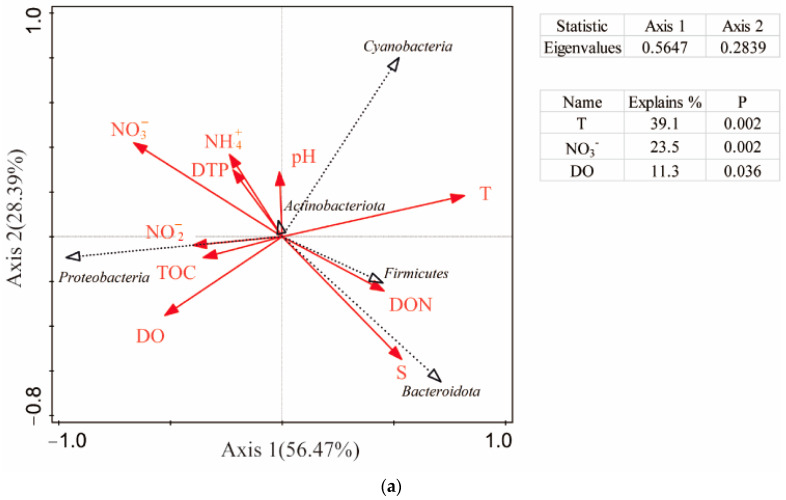
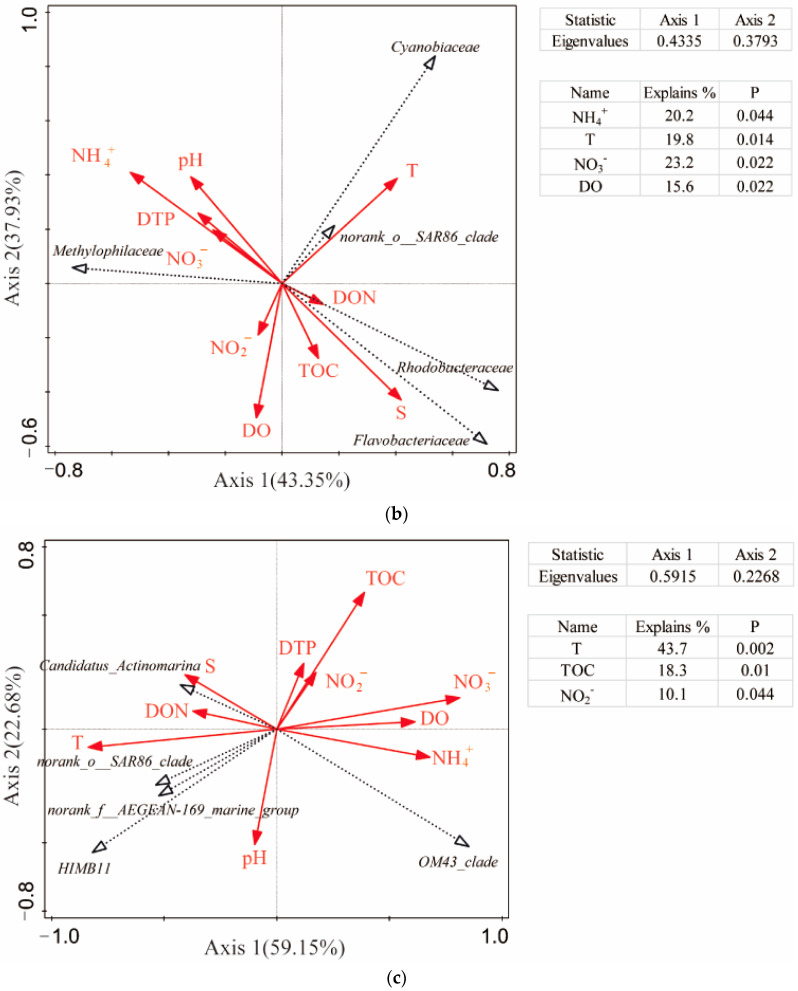
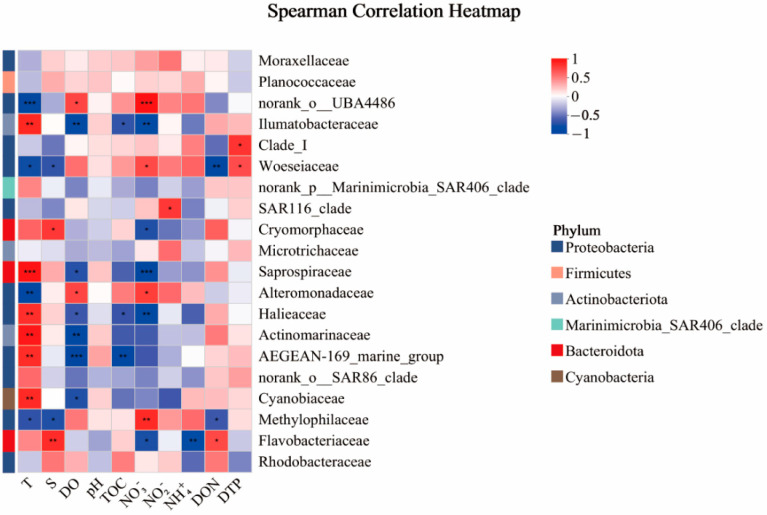
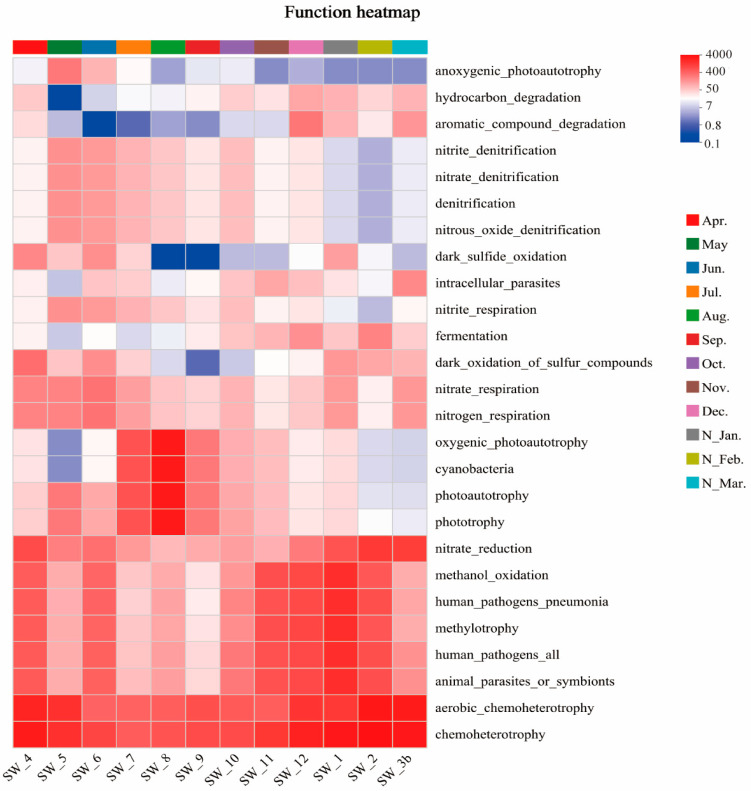
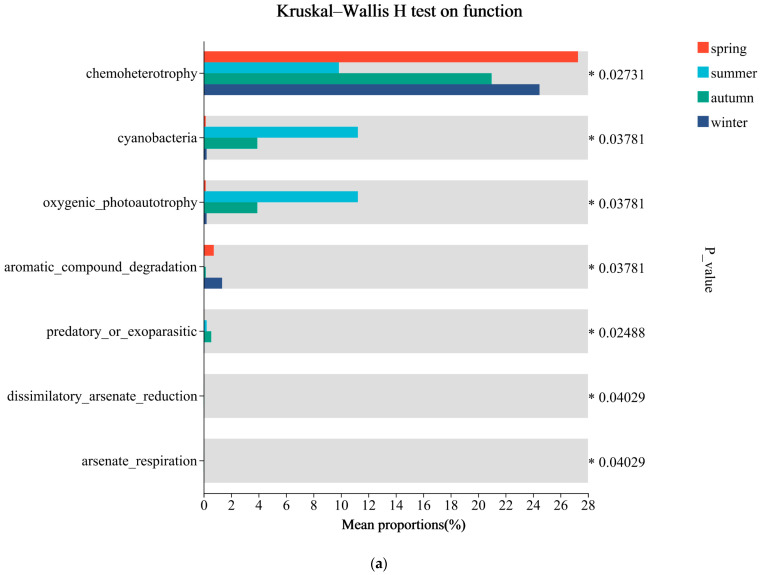
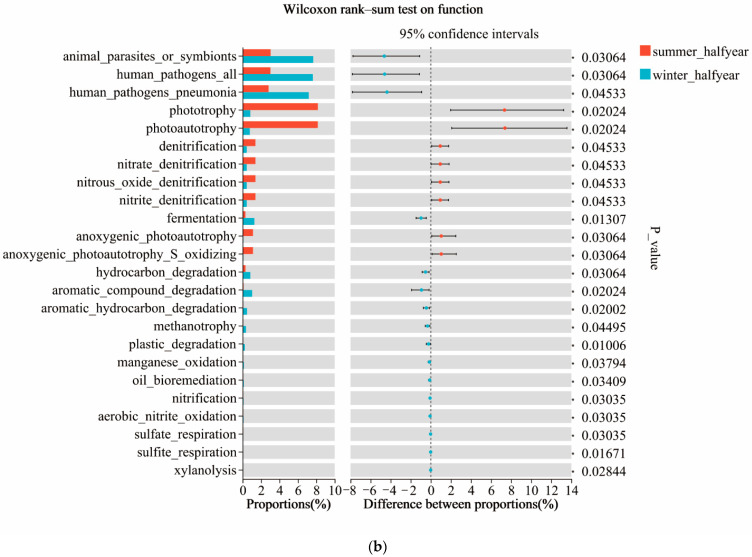
This study investigated the monthly variations of bacterial communities in the surface seawater of the Wenzhou coastal area and their influencing factors, while exploring the ecological functions of microbial communities. The results indicated that the surface seawater bacterial communities in this region exhibited high diversity, with significantly higher diversity observed in the winter half-year compared to the summer half-year. The bacterial community structures showed distinct monthly variations, with high similarity between adjacent months, particularly from June to September. The dominant bacterial taxa primarily included Proteobacteria represented by the SAR86 clade, OM43 clade, and Rhodobacteraceae; Bacteroidota represented by Flavobacteriaceae; and Cyanobacteria mainly composed of Cyanobium PCC-6307 and Synechococcus CC9902. Temperature and nitrate ions were identified as the environmental factors most strongly correlated with monthly bacterial community variations, while dissolved oxygen, nitrite ions, and total organic carbon also showed significant correlations with relative abundances of certain taxa. Predictions of the bacterial community's ecological functions revealed that chemoheterotrophic functions were most abundant throughout the year, whereas photoautotrophic functions were primarily enriched in summer. Denitrification and other nitrogen cycling-related functions also displayed obvious monthly variations. Collectively, this study provides valuable insights into the temporal changes in coastal microbial communities and their interactions with different environments.
Keywords: bacterial communities; ecological functions; environmental factors; monthly variations; surface seawater.
Conflict of interest statement
The authors declare no conflicts of interest.
Figures
References
-
- Das S., Mangwani N. Ocean acidification and marine microorganisms: Responses and consequences. Oceanologia. 2015;57:349–361. doi: 10.1016/j.oceano.2015.07.003. - DOI
-
- Raven J.A., Falkowski P.G. Oceanic sinks for atmospheric CO2. Plant Cell Environ. 1999;22:741–755. doi: 10.1046/j.1365-3040.1999.00419.x. - DOI
-
- Capone D.G., Zehr J.P., Paerl H.W., Bergman B., Carpenter E.J. Trichodesmium, a Globally Significant Marine Cyanobacterium. Science. 1997;276:1221–1229. doi: 10.1126/science.276.5316.1221. - DOI
Grants and funding
LinkOut - more resources
Full Text Sources
