

Revealing the Characteristics and Correlations Among Microbial Communities, Functional Genes, and Vital Metabolites Through Metagenomics in Henan Mung Bean Sour
- PMID: 40284681
- PMCID: PMC12029783
- DOI: 10.3390/microorganisms13040845
Revealing the Characteristics and Correlations Among Microbial Communities, Functional Genes, and Vital Metabolites Through Metagenomics in Henan Mung Bean Sour
Abstract
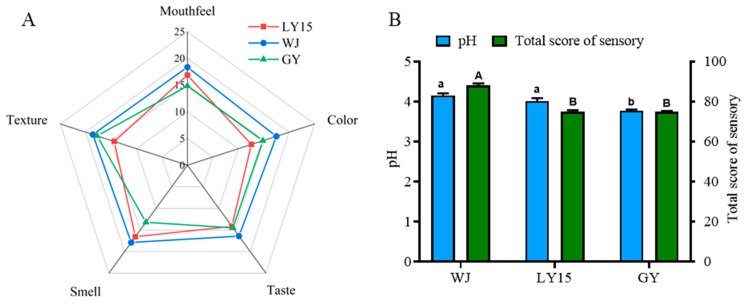
Henan mung bean sour (HMBS) is the raw material for mung bean sour noodles (MBSNs), a traditional fermented food. To investigate the characteristic flavor compounds, we have detected the content of free amino acids (FAAs) and key metabolites including organic acids, sugars, and alcohols. The results revealed that the content associated with umami, sweetness, and bitterness (TVA > 1) showed significant differences. Metagenomic analysis indicated that Lactobacillus delbrueckii was the dominant and characteristic species in WJ and LY15, whereas Bifidobacterium mongoliense, Lactiplantibacillus plantarum, and Acetobacter indonesiensis were the dominant species in GY. The abundance of functional genes related to carbohydrate and amino acid metabolism was higher in WJ and LY15. There was a strong correlation between dominant genera and vital metabolites (r |>| 0.7). This study provides a theoretical foundation for the development of HMBS.
Keywords: Henan mung bean sour; dominant genera; functional genes; metabolites; metagenomics.
Conflict of interest statement
The authors declare that they have no known competing financial interests or personal relationships that could have appeared to influence the work reported in this paper.
Figures


Similar articles
-
Microbiome Flora and Metabolomics Analysis of Mung Bean Sour Liquid in Luoyang, China.Foods. 2025 Feb 5;14(3):511. doi: 10.3390/foods14030511. Foods. 2025. PMID: 39942104 Free PMC article.
-
The impact of lactic acid bacteria inoculation on the fermentation and metabolomic dynamics of indigenous Beijing douzhi microbial communities.Front Microbiol. 2024 Jul 30;15:1435834. doi: 10.3389/fmicb.2024.1435834. eCollection 2024. Front Microbiol. 2024. PMID: 39139380 Free PMC article.
-
Exploring the flavor changes in mung bean flour through Lactobacillus fermentation: insights from volatile compounds and non-targeted metabolomics analysis.J Sci Food Agric. 2024 Sep;104(12):7238-7248. doi: 10.1002/jsfa.13545. Epub 2024 Apr 29. J Sci Food Agric. 2024. PMID: 38625751
-
Mung bean as a potent emerging functional food having anticancer therapeutic potential: Mechanistic insight and recent updates.Biotechnol Appl Biochem. 2023 Dec;70(6):2002-2016. doi: 10.1002/bab.2505. Epub 2023 Aug 13. Biotechnol Appl Biochem. 2023. PMID: 37574464 Review.
-
Recent advances in mung bean protein: From structure, function to application.Int J Biol Macromol. 2024 Jul;273(Pt 2):133210. doi: 10.1016/j.ijbiomac.2024.133210. Epub 2024 Jun 17. Int J Biol Macromol. 2024. PMID: 38897499 Review.
References
-
- Abdeldaiem A.M., Ali A.H., Shah N., Ayyash M., Mousa A.H. Physicochemical analysis, rheological properties, and sensory evaluation of yogurt drink supplemented with roasted barley powder. LWT. 2023;173:114319. doi: 10.1016/j.lwt.2022.114319. - DOI
-
- Bao T., Deng S., Yu K., Li W., Dong A. Metagenomic insights into seasonal variations in the soil microbial community and function in a Larix gmelinii forest of Mohe, China. J. For. Res. 2020;32:371–383. doi: 10.1007/s11676-019-01090-w. - DOI
-
- Behera B.C., Mishra R., Mohapatra S. Microbial citric acid: Production, properties, application, and future perspectives. Food Front. 2021;2:62–76. doi: 10.1002/fft2.66. - DOI
-
- Chen J.-B., Li G., Chen X., Liao L.-H., He Y.-Q., Ye F., Chen G.-X. Nutritional value and antioxidant activity of Artemisia princeps, an edible plant frequently used in folk food in the Xiangxi region. Food Med. Homol. 2025;2:9420051. doi: 10.26599/FMH.2025.9420043. - DOI
Grants and funding
LinkOut - more resources
Full Text Sources
