

Wastewater Speaks: Evaluating SARS-CoV-2 Surveillance, Sampling Methods, and Seasonal Infection Trends on a University Campus
- PMID: 40284761
- PMCID: PMC12029416
- DOI: 10.3390/microorganisms13040924
Wastewater Speaks: Evaluating SARS-CoV-2 Surveillance, Sampling Methods, and Seasonal Infection Trends on a University Campus
Abstract
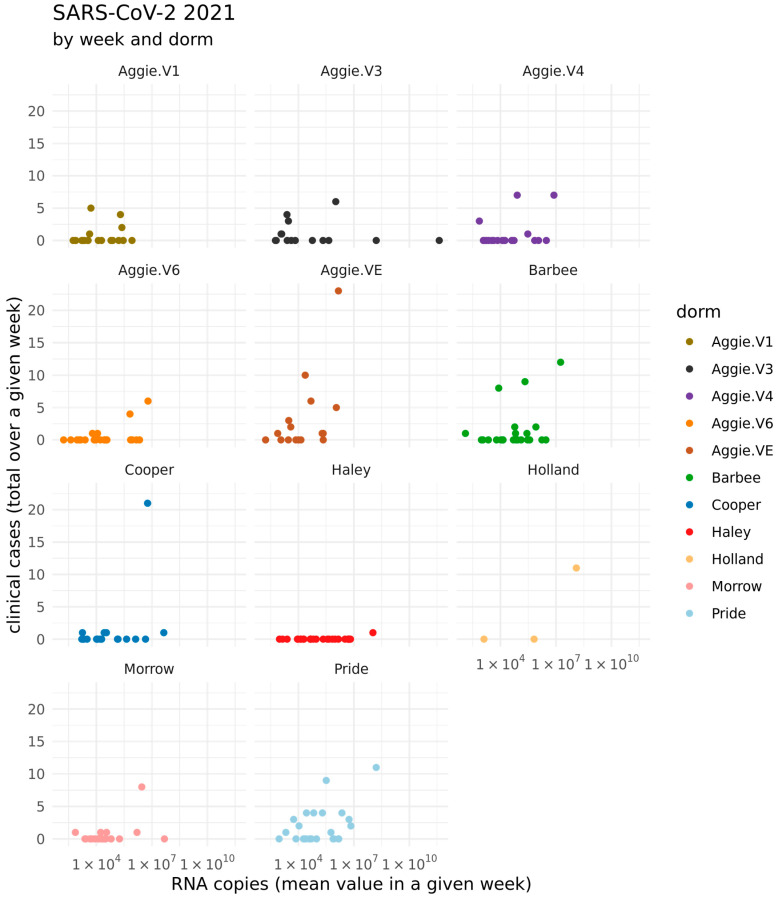
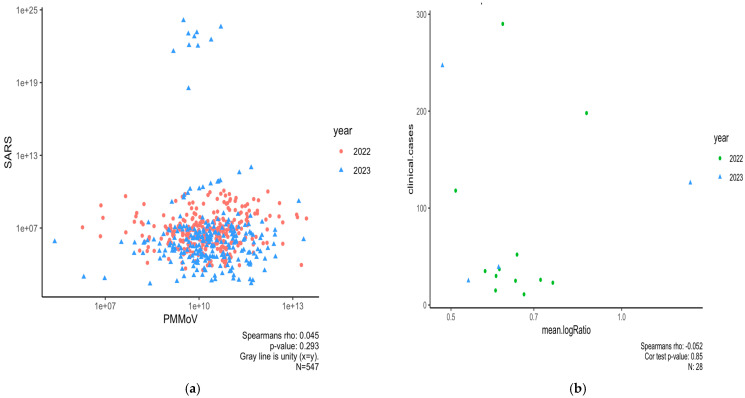
Wastewater surveillance has emerged as a cost-effective and equitable approach for tracking the spread of SARS-CoV-2. In this study, we monitored the prevalence of SARS-CoV-2 on a university campus over three years (2021-2023) using wastewater-based epidemiology (WBE). Wastewater samples were collected from 11 manholes on campus, each draining wastewater from a corresponding dormitory building, and viral RNA concentrations were measured using reverse transcription-quantitative PCR (RT-qPCR). Weekly clinical case data were also obtained from the university health center. A strong positive and significant correlation was observed between Grab and Composite sampling methods, supporting their robustness as equally effective approaches for sample collection. Specifically, a strong correlation was observed between Aggie Village 4 Grab and Aggie Village 4 Composite samples (R2 = 0.84, p = 0.00) and between Barbee Grab and Barbee Composite samples (R2 = 0.80, p = 0.00). Additionally, higher viral RNA copies of SARS-CoV-2 (N1 gene) were detected during the Spring semester compared to the Fall and Summer semesters. Notably, elevations in raw N1 concentrations were observed shortly after the return of college students to campus, suggesting that these increases were predominantly associated with students returning at the beginning of the Fall and Spring semesters (January and August). To account for variations in fecal loading, SARS-CoV-2 RNA concentrations were normalized using Pepper Mild Mottle Virus (PMMoV), a widely used viral fecal biomarker. However, normalization using PMMoV did not improve correlations between SARS-CoV-2 RNA levels and clinical case data. Despite these findings, our study did not establish WBE as a consistently reliable complement to clinical testing in a university campus setting, contrary to many retrospective studies. One key limitation was that numerous off-campus students did not contribute to the campus wastewater system corresponding to the monitored dormitories. However, some off-campus students were still subjected to clinical testing at the university health center under mandated protocols. Moreover, the university health center discontinued reporting cases per dormitory after 2021, making direct comparisons more challenging. Nevertheless, this study highlights the continued value of WBE as a surveillance tool for monitoring infectious diseases and provides critical insights into its application in campus environments.
Keywords: PMMoV normalization; SARS-CoV-2 RNA detection; grab and composite wastewater sampling; university public health surveillance; wastewater-based epidemiology.
Conflict of interest statement
The authors declare no conflicts of interest.
Figures


Similar articles
-
Targeted wastewater surveillance of SARS-CoV-2 on a university campus for COVID-19 outbreak detection and mitigation.Environ Res. 2021 Sep;200:111374. doi: 10.1016/j.envres.2021.111374. Epub 2021 May 29. Environ Res. 2021. PMID: 34058182 Free PMC article.
-
Implementing an adaptive, two-tiered SARS-CoV-2 wastewater surveillance program on a university campus using passive sampling.Sci Total Environ. 2024 Feb 20;912:168998. doi: 10.1016/j.scitotenv.2023.168998. Epub 2023 Nov 29. Sci Total Environ. 2024. PMID: 38040360
-
Wastewater surveillance of SARS-CoV-2 in dormitories as a part of comprehensive university campus COVID-19 monitoring.Environ Res. 2022 Sep;212(Pt E):113580. doi: 10.1016/j.envres.2022.113580. Epub 2022 Jun 6. Environ Res. 2022. PMID: 35671797 Free PMC article.
-
Passive sampling to scale wastewater surveillance of infectious disease: Lessons learned from COVID-19.Sci Total Environ. 2022 Aug 20;835:155347. doi: 10.1016/j.scitotenv.2022.155347. Epub 2022 Apr 20. Sci Total Environ. 2022. PMID: 35460780 Free PMC article. Review.
-
A scoping review of global SARS-CoV-2 wastewater-based epidemiology in light of COVID-19 pandemic.Heliyon. 2024 May 3;10(9):e30600. doi: 10.1016/j.heliyon.2024.e30600. eCollection 2024 May 15. Heliyon. 2024. PMID: 38765075 Free PMC article.
References
Grants and funding
LinkOut - more resources
Full Text Sources
Miscellaneous
