. 2025 Apr 17;13(4):930.
doi: 10.3390/microorganisms13040930.

The Subgingival Microbial Composition in Health and Periodontitis with Different Probing Depths

Affiliations

The Subgingival Microbial Composition in Health and Periodontitis with Different Probing Depths

Jingyan Wang et al. Microorganisms. .

Abstract

The differences in microbiota between periodontitis and health have been extensively studied; however, knowledge about how the microbiota shifts from shallow to deep periodontal pockets remains limited despite its clinical importance in disease progres-sion and management. Patients diagnosed with stage III periodontitis commonly pre-sent varied probing depths (PD) within the same oral cavity, reflecting localized disease severity. This study aims to analyze the microbiome of subgingival plaques at various PDs in periodontitis patients. Subgingival plaques were collected from sixteen healthy subjects (health group) and periodontal pockets of sixteen stage III periodontitis pa-tients (PD 0-3 mm, PD 4-5 mm and PD 6-9 mm groups). A total of 64 subgingival plaque samples underwent 16S rRNA gene sequencing. The PD 6-9 mm group exhib-ited significantly higher alpha diversity than the health group, and distinct subgingival microbial community structures were observed in periodontitis patients, regardless of probing depth. The relative abundance of specific genera differed notably between health and periodontitis states; Corynebacterium and Cardiobacterium decreased, whereas Schaalia increased in shallow pockets (PD 0-3 mm) of periodontitis relative to the health group. Co-occurrence network analysis on the species level revealed that the PD 4-5 mm group had the most complex interspecies interactions, followed by the PD 6-9 mm and PD 0-3 mm groups. These findings indicate significant variations in mi-crobial diversity, composition, and interspecies interactions associated with periodon-tal health and periodontitis severity, highlighting their potential relevance for clinical diagnosis and targeted therapeutic strategies.

Keywords: microbiome; periodontitis; probing depth (PD); subgingival dental plaque.


Conflict of interest statement

The authors declare no conflicts of interest.

Figures

Figure 1
Figure 1
The flowchart of subgingival plaque sample collection and comparison of microbiota alpha and beta diversity among the four groups. (a) The sampling strategies of this study. Subgingival plaque samples collected from periodontal healthy subjects were designated as the health group; subgingival plaque samples collected from periodontitis patients from a probing depth of 0–3 mm, 4–5 mm, and 6–9 mm sites were designated as the PD 0–3 mm group, PD 4–5 mm group, and PD 6–9 mm group, respectively. (b) Microbial alpha diversity as calculated by the Chao, Pielou_e, Shannon, and Coverage index. Comparison among groups were calculated by the Kruskal–Wallis test with FDR (false discovery rate); Welch’s (uncorrected) test was used as a post hoc test. (c) The principal coordinates analysis (PCoA) of beta diversity among the four groups was based on the Bray–Curtis and Abund-Jaccard tests. The ellipses indicate 95% confidence intervals for sample groups. (d) The beta diversity difference analysis based on the Bray–Curtis and Abund-Jaccard tests were calculated by the Wilcoxon rank-sum test with FDR. The y-axis represents the beta diversity distance values. * p ≤ 0.05; ** p ≤ 0.01; *** p ≤ 0.001.
Figure 2
Figure 2
Phylum-level microbiota composition has significant relative abundance differences among the four groups. (a) Six phyla, including Proteobacteria, Saccharibacteria (TM7), Spirochaetes, Synergistetes, Chloroflexi, and Tenericutes, showed significant differences among the four groups. The Kruskal–Wallis test with FDR was used to compare differences among groups; Welch’s (uncorrected) test was used as a post hoc test. * p < 0.05, ** p < 0.01, *** p < 0.001. (b) Relative abundance shift patterns for each of the six phyla across the four groups. Each point in the figure shows the relative abundance of the bacterial phylum in the sample. The blue trend line is the fitted curve of the average relative abundance, and the gray shaded area shows the interval of the standard deviation.
Figure 3
Figure 3
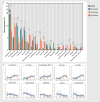
Genus-level microbiota composition has significantly different relative abundance among the four groups. (a) The top 20 genera have significant differences among the four groups. The Kruskal–Wallis test with FDR was used to compare differences among groups, and Welch’s (uncorrected) test was used as a post hoc test. * p < 0.05, ** p < 0.01, *** p < 0.001. (b) Relative abundance shift patterns for the top 10 genera across the four groups.Each point in the figure shows the relative abundance of the bacterial phylum in the sample. The blue trend line is the fitted curve of the average relative abundance, and the gray shaded area shows the interval of the standard deviation.
Figure 4
Figure 4
Co-occurrence network of species with relative abundance > 1% in each group. (a) Health group. (b) PD 0–3 mm group. (c) PD 4–5 mm group. (d) PD 6–9 mm group. Species’ relative abundance and correlation coefficient values are presented by nodes and edges. The size of the nodes and node fonts represent the average relative abundance of species in each group. The color of the nodes (red, orange, yellow, purple, green, and blue) represents the six periodontitis complexes according to the Socransky classification with species not belonging to the six complexes shown as grey nodes. The correlation coefficient r values were determined using Spearman correlation analysis, with the thickness of the lines positively correlated with the absolute value of the r values. Pink edges indicate positive correlations (r > 0.4, p < 0.05), while grey edges indicate negative correlations (r < −0.4, p < 0.05).
Figure 5
Figure 5
Venn diagrams of the four groups based on the species level. The numbers and percentages in the overlapping areas represent species shared between corresponding groups. Species unique to each group are listed in the surrounding text boxes.

Similar articles

References

    1. Mombelli A. Microbial colonization of the periodontal pocket and its significance for periodontal therapy. Periodontology 2000. 2018;76:85–96. doi: 10.1111/prd.12147. - DOI - PubMed
    1. Slots J. Periodontitis: Facts, fallacies and the future. Periodontology 2000. 2017;75:7–23. doi: 10.1111/prd.12221. - DOI - PubMed
    1. Papapanou P.N., Sanz M., Buduneli N., Dietrich T., Feres M., Fine D.H., Flemmig T.F., Garcia R., Giannobile W.V., Graziani F., et al. Periodontitis: Consensus report of workgroup 2 of the 2017 World Workshop on the Classification of Periodontal and Peri-Implant Diseases and Conditions. J. Clin. Periodontol. 2018;89:S162–S170. - PubMed
    1. Van der Velden U. What exactly distinguishes aggressive from chronic periodontitis: Is it mainly a difference in the degree of bacterial invasiveness? Periodontology 2000. 2017;75:24–44. doi: 10.1111/prd.12202. - DOI - PubMed
    1. Berezow A.B., Darveau R.P. Microbial shift and periodontitis. Periodontology 2000. 2011;55:36–47. doi: 10.1111/j.1600-0757.2010.00350.x. - DOI - PMC - PubMed

LinkOut - more resources