. 2025 Mar 26;17(4):471.
doi: 10.3390/v17040471.

HTLV-1 p13 Protein Hijacks Macrophage Polarization and Promotes T-Cell Recruitment

Affiliations

HTLV-1 p13 Protein Hijacks Macrophage Polarization and Promotes T-Cell Recruitment

Ramona Moles et al. Viruses. .

Abstract

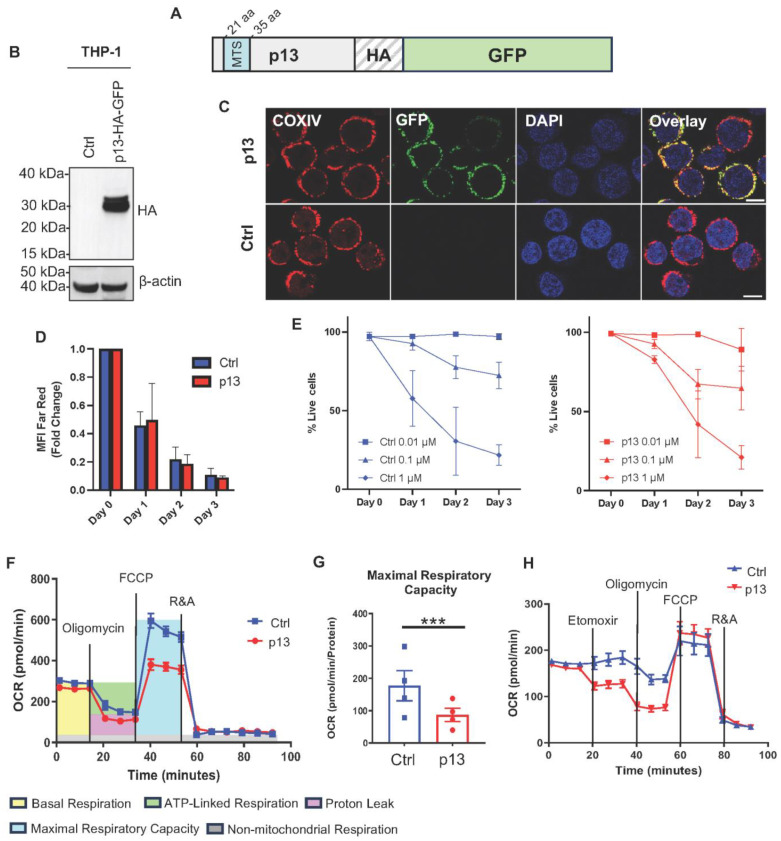
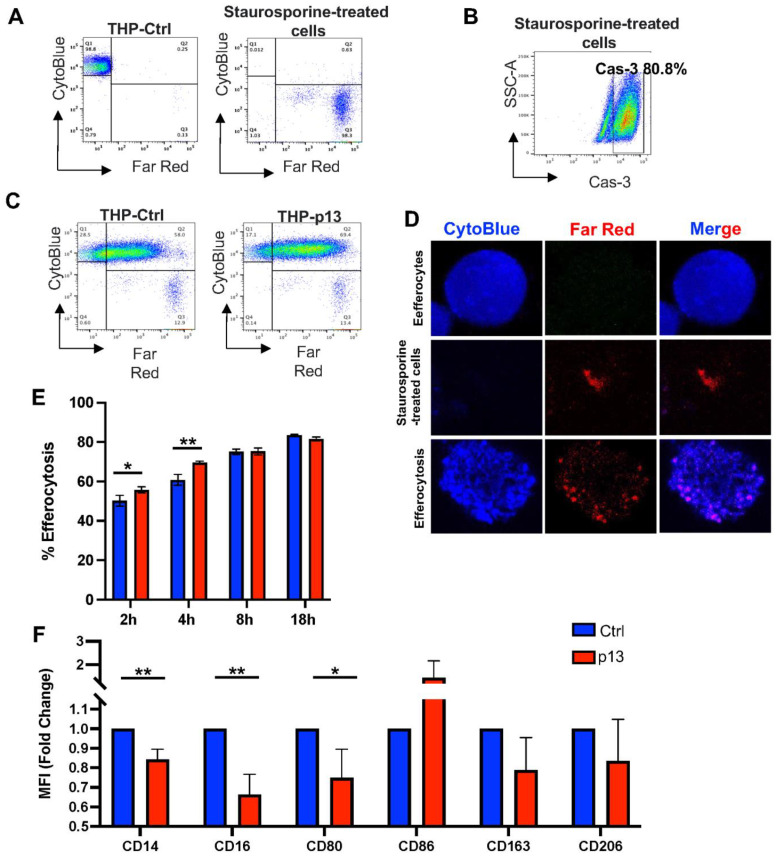
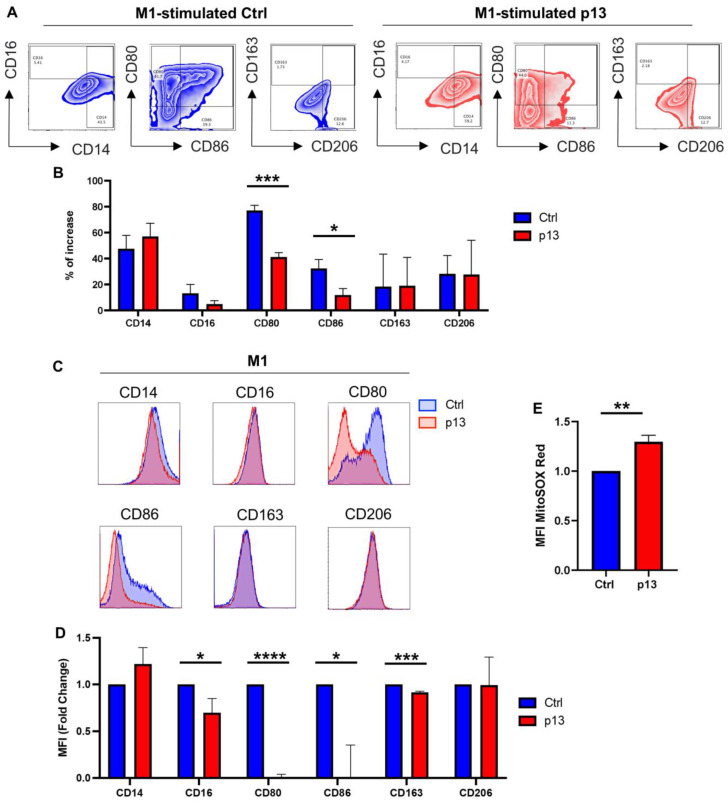
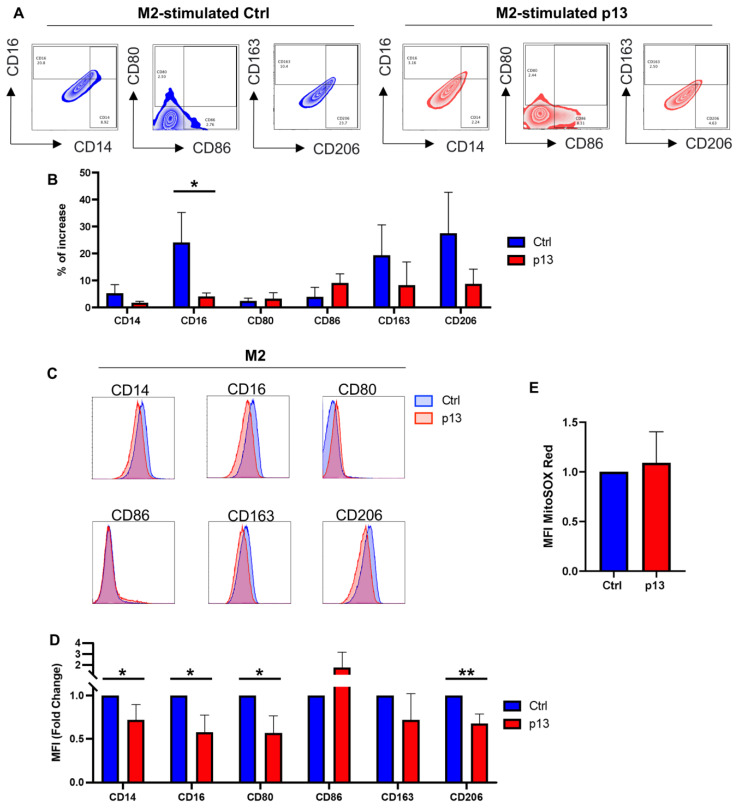
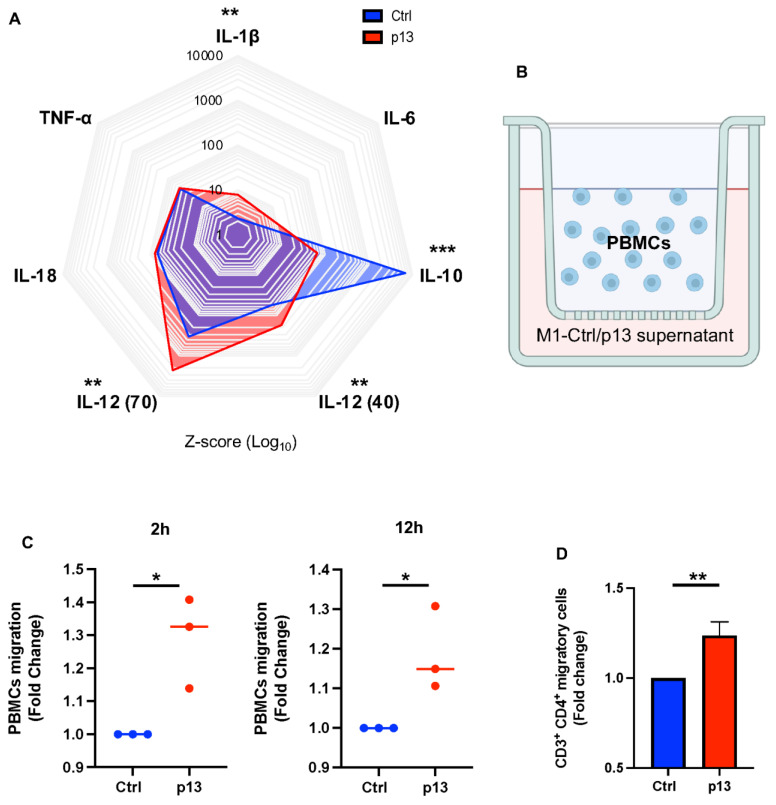
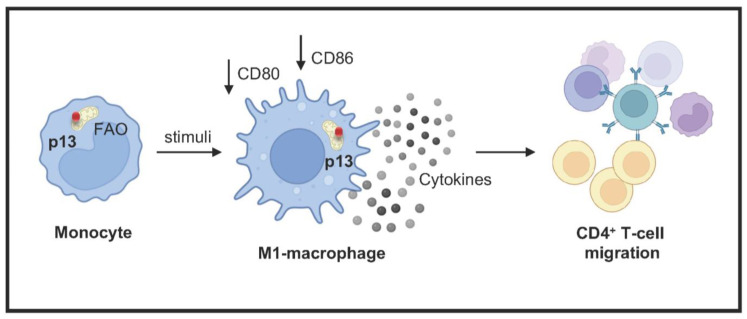
The human T-cell leukemia type-1 (HTLV-1) retrovirus establishes chronic life-long infection in a fraction of infected individuals associated with severe pathological conditions. Although the mechanism driving disease development is not fully understood, current evidence indicates the essential functions of viral regulatory proteins. Among these, the p13 protein has previously been shown to localize to the inner mitochondrial membrane in T cells, altering mitochondrial biology and T-cell function. While CD4+ T cells are the primary cell target of HTLV-1 infection, genomic viral DNA has also been detected in monocytes, macrophages, and dendritic cells, which orchestrate innate and adaptive immunity and play a critical role in protecting against virus-induce diseases by establishing the appropriate balance of pro and anti-inflammatory responses. Given the central role of mitochondria in monocyte differentiation, we investigated the effect of p13 in monocytes/macrophages and found that by localizing to mitochondria, p13 affects mitochondrial respiration. Moreover, we demonstrate that p13 expression affects macrophage polarization to favor the recruitment of CD4+ T cells, the primary target of the virus, potentially facilitating the spread of viral infection and the development of disease.

Keywords: ATLL; HAM/TSP; HTLV-1; HTLV-1 associated myelopathy/tropical spastic paraparesis; adult-T-cell leukemia/lymphoma; cytokines; macrophages; mitochondria; monocytes; p13; viral protein.


Conflict of interest statement

The authors declare no conflicts of interest. The funders had no role in the design of the study; in the collection, analyses, or interpretation of data; in the writing of the manuscript; or in the decision to publish the results.

Figures

Figure 1
Figure 1
P13 targets mitochondria in monocytic cells. (A) Schematic representation of p13-HA-GFP viral protein. The p13 protein fused to HA and GFP carboxy terminal tags was cloned in a retroviral vector pBABE. The N-terminal region of p13 has a mitochondrial targeting sequence (MTS) from amino acids 21 to 35. (B) Immunoblot for HA expression from total cellular extracts of THP-1 cells transduced with retrovirus expressing p13-HA-GFP. Cells transduced with empty retrovirus were used as control (Ctrl). β-Actin expression was used as a loading control. (C) Stable cell lines THP-Ctrl or THP-p13 were adhered to glass slides by cytospin and stained with an antibody to complex IV (COXIV). Scale bar: 10 µm. (D) Proliferation assay of THP-Ctrl or THP-p13. Cells were stained with CellTrace™ Far Red, and MFI was measured by flow cytometry every 24 h for three days. The results of three independent experiments were graphed; Ctrl is labeled in blue, and p13-expressing cells in red. Statistical significance was verified with a Student’s t-test. No statistical significance was noted between p13-expressing cells and Ctrl. (E) THP-Ctrl and THP-p13 cells following the treatment with increased concentration of Staurosporine (0.01, 0.1, 1 μM). Cells were stained with Live/Dead Fixable Blue dye (ThermoFisher Scientific) to measure the percentage of live cells every 24 h for three days by flow cytometry. The results of three independent experiments were graphed; Ctrl and p13 cells are labeled in blue and red, respectively. Statistical significance was verified with a Student’s t-test. No statistical significance was noted between p13-expressing cells and Ctrl. (F) Seahorse extracellular flux analysis measured the oxygen consumption rate in THP-p13 or THP-Ctrl cells. A representative rate of spare respiratory capacity is shown. Different mitochondrial parameters are as follows: basal respiration (yellow), ATP-linked respiration (green), proton leak (magenta), maximal respiratory capacity (blue), and non-mitochondrial respiration (gray). (G) The maximal respiratory capacity rate was graphed for THP-Ctrl (blue) and THP-p13 (red). Statistical significance was verified with a Student’s t-test and reported in the figure. The p-values are summarized with asterisks, *** (p ≤ 0.001). (H) Seahorse extracellular flux analysis measured the oxygen consumption rate in p13-expressing and control THP cells.
Figure 2
Figure 2
P13 affects efferocytosis and macrophage differentiation. (A) The THP-p13 (red) and THP-Ctrl (blue) cells were labeled with CytoTell Blue according to the manufacturer’s instructions and treated with PMA to induce maturation (left). Target cells, 729 HTLV-1 WT, were labeled with Far Red and treated with 1 μM of Staurosporine for 3 h (middle). (B) Cell death of Staurosporine-treated cells was measured by straining cells with Caspase 3. (C) Target cells were added to the well at an effector to target cell ratio of 1:1 and left for 2, 4, 8, and 18 h. Efferocytosis was measured by gating singlets and the double CytoTell Blue and Far Red positive cells. (D) Following 2 h co-cultivation, THP cells labeled with CytoTell Blue and Staurosporine-treated cells (Far Red) were imaged to confirm cell engulfment. (E) Results of three independent experiments were graphed; Ctrl and p13-expressing cells are labeled in blue and red, respectively. (F) Following PMA treatment, THP-p13 and THP-Ctrl cells were collected and stained for CD14, CD16, CD80, CD86, CD163, and CD206 surface markers and viability dye. Cells were gated by size, singled, and live. For THP-p13, cells were additionally gated for GFP. The MFI of each marker was graphed as a fold change compared to the PMA-treated control cells. The results of three independent experiments are shown. (E,F) Statistical significance was verified with a Student’s t-test and reported in the figure. p-values are summarized with asterisks, * (p ≤ 0.05), ** (p ≤ 0.01).
Figure 3
Figure 3
Role of p13 in M1 macrophage polarization. (A) THP-p13 and THP-Ctrl cells were treated with PMA at a final concentration of 10 ng/mL for 24 h. Cells were washed gently with medium, and appropriate stimulation was added for 48 h. M1 stimuli: LPS 15 ng/mL and IFN-γ 50 ng/mL. Following 48 h, cells were collected and stained for CD14, CD16, CD80, CD86, CD163, and CD206 surface markers and viability dye. Cells were gated by size, singled, and live. For THP-p13, cells were additionally gated for GFP. The percentage of increased CD14 and CD16; CD80 and CD86; CD163 and CD206 positive cells following stimulation was graphed. (B) The percentage of increased frequency of CD14, CD16, CD80, CD86, CD163, and CD206 compared to untreated THP-Ctrl was graphed. The results of three independent experiments are shown; Ctrl and p13-expressing cells are labeled in blue and red, respectively. (C) Representative mean fluorescence intensity (MFI) histograms for CD14, CD16, CD80, CD86, CD163, and CD206 surface markers are shown. THP-Ctrl and THP-p13 cells are colored in blue and red, respectively. (D) MFI of CD14, CD16, CD80, CD86, CD163, and CD206 surface markers of THP-p13 was graphed as a fold change compared to THP-Ctrl. The results of three independent experiments are shown; Ctrl is labeled in blue and p13-expressing cells are labeled in red. (E) MitoSOX-based flow cytometry with Red fluorescence was used to measure mitochondrial ROS formation in p13 M1 differentiated cells compared to the M1 differentiated control. The results of three independent experiments were graphed as a fold change. (B,D,E) Statistical significance was verified with a Student’s t-test and reported in the figure. p-values are summarized with asterisks, * (p ≤ 0.05), ** (p ≤ 0.01), *** (p ≤ 0.001), and **** (p ≤ 0.0001).
Figure 4
Figure 4
Role of p13 in M2 macrophage polarization. (A) THP-p13 and THP-Ctrl cells were treated with PMA at a final concentration of 10 ng/mL for 24 h. Cells were washed gently with medium, and appropriate stimulation was added for 48 h. M2 stimuli: IL-4 (25 ng/mL) and IL-13 (25 ng/mL). After 48 h, cells were collected and stained for CD14, CD16, CD80, CD86, CD163, and CD206 surface markers. Viability dye was also included. Cells were gated by size, single and live cells. THP-p13 cells were also gated for GFP. The percentage of increased CD14 and CD16, CD80 and CD86, and CD163 and CD206 positive cells following stimulation was graphed. (B) The percentage of increased frequency of CD14, CD16, CD80, CD86, CD163, and CD206 in THP-p13 compared to THP-Ctrl was graphed. The results of three independent experiments are shown: Ctrl cells are labeled in blue, and p13-expressing cells are labeled in red. (C) Representative MFI histograms for CD14, CD16, CD80, CD86, CD163, and CD206 surface markers. Ctrl and p13-expressing cells are colored in blue and red, respectively. (D) Fold change in MFI of CD14, CD16, CD80, CD86, CD163, and CD206 surface markers for THP-p13 cells compared to THP-Ctrl is graphed for three independent experiments; Ctrl labeled in blue and p13 labeled in red. (E) MitoSOX-based flow cytometry with Red fluorescence was used to measure mitochondrial ROS formation in M2 differentiated THP-p13 or THP-Ctrl cells. The results of three independent experiments were graphed as a fold change. ROS formation was not statistically significant in M2 differentiated THP-p13 compared to THP-Ctrl cells. (B,D,E) Statistical significance was verified with a Student’s t-test and reported in the figure. p-values are summarized with asterisks, * (p ≤ 0.05), ** (p ≤ 0.01).
Figure 5
Figure 5
Functional role of M1 p13 cytokine profile. (A) Cytokine release of THP-p13 or THP-Ctrl cells following M1 stimulation was measured by Luminex multiplex and graphed as a radial plot (z-score). (B) Schematic representation of experimental design. Supernatant from M1 differentiated THP-Ctrl or THP-p13 cells was added to the lower chamber of the trans-well plate. Human PBMCs isolated from 3 different normal donors were plated in the upper trans-well chamber. (C) Migration of human PBMCs was measured by cell count at 2 or 12 h following incubation. (D) Following migration, cells were collected and stained for CD3+ CD4+ and viability dye. The frequency of CD3+ CD4+ cells was used to calculate the total number of CD3+ CD4+ migrated cells, which was graphed as a fold change. (A,D) Statistical significance was verified with a Student’s t-test and reported in the figure. p-values are summarized with asterisks, * (p ≤ 0.05), ** (p ≤ 0.01), and *** (p ≤ 0.001).
Figure 6
Figure 6
Biological effect of p13 expression in myeloid cells. Schematic representation of the putative role of HTLV-1 p13 protein in monocytes. The p13 protein (red) localizes to the mitochondria, induces metabolic changes, and influences cell differentiation. p13 reduces the expression of surface receptors (CD80 and CD86) affecting M1 macrophage polarization, a critical aspect of antiviral responses, and alters cytokine/chemokine release. This shift in the immune response may be associated in vivo with the recruitment of CD4+ T cells, the primary target of HTLV-1, potentially facilitating the spread of infection.

Similar articles

References

    1. Poiesz B.J., Ruscetti F.W., Gazdar A.F., Bunn P.A., Minna J.D., Gallo R.C. Detection and isolation of type C retrovirus particles from fresh and cultured lymphocytes of a patient with cutaneous T-cell lymphoma. Proc. Natl. Acad. Sci. USA. 1980;77:7415–7419. doi: 10.1073/pnas.77.12.7415. - DOI - PMC - PubMed
    1. Takatsuki K. Discovery of adult T-cell leukemia. Retrovirology. 2005;2:16. doi: 10.1186/1742-4690-2-16. - DOI - PMC - PubMed
    1. Gessain A., Barin F., Vernant J.C., Gout O., Maurs L., Calender A., de The G. Antibodies to human T-lymphotropic virus type-I in patients with tropical spastic paraparesis. Lancet. 1985;2:407–410. doi: 10.1016/s0140-6736(85)92734-5. - DOI - PubMed
    1. Osame M., Usuku K., Izumo S., Ijichi N., Amitani H., Igata A., Matsumoto M., Tara M. HTLV-I associated myelopathy, a new clinical entity. Lancet. 1986;1:1031–1032. doi: 10.1016/s0140-6736(86)91298-5. - DOI - PubMed
    1. Kamoi K., Mochizuki M. HTLV-1 uveitis. Front. Microbiol. 2012;3:270. doi: 10.3389/fmicb.2012.00270. - DOI - PMC - PubMed

Publication types

MeSH terms

LinkOut - more resources