. 2025 Mar 28;17(4):488.
doi: 10.3390/v17040488.

Role of Defective Interfering Particles in Complement-Mediated Lysis of Parainfluenza Virus-Infected Cells

Affiliations

Role of Defective Interfering Particles in Complement-Mediated Lysis of Parainfluenza Virus-Infected Cells

Jenna R Aquino et al. Viruses. .

Abstract

RNA viruses pose a significant global public health burden due to their high mutation rates, zoonotic potential, and ability to evade immune responses. A common aspect of their replication is the generation of defective interfering particles (DIPs), which contain truncated defective viral genomes (DVGs) that depend on full-length standard (STD) virus for replication. DVGs have gained recognition as they are increasingly detected in clinical samples from natural infections. While their role in modulating type I interferon (IFN-I) responses is well established, their impact on the complement (C') system is not understood. In this study, we examined how DVGs influence C'-mediated lysis during parainfluenza virus 5 (PIV5) infection using real-time in vitro cell viability assays. Our results demonstrated that C' effectively killed human lung epithelial cells infected with STD PIV5, whereas co-infection with DIP-enriched stocks significantly suppressed C'-mediated killing through mechanisms that were dependent on DVG replication but independent of IFN-I production. The titration of DI units in co-infection with STD PIV5 showed a strong linear relationship between DIP-mediated decreases in surface viral glycoprotein expression and the inhibition of C'-mediated lysis. Our findings reveal a previously unrecognized function of DVGs in modulating C' pathways, shedding light on their potential role in viral persistence and immune evasion.

Keywords: complement; defective interfering particles; defective viral genomes; interferon-beta; parainfluenza virus type 5.


Conflict of interest statement

The authors declare no conflicts of interest.

Figures

Figure 1
Figure 1
Generation of DIP-enriched PIV5 Stocks. An STD PIV5 infection of Vero cells was used to initiate rounds of serial undiluted passage of virus through Vero cells. At each cell pass, media was harvested and titered (HA/mL) by hemagglutination assay. Viral stocks with titers below 200 HA/mL were considered DIP-enriched PIV5 stocks and utilized for subsequent experiments.
Figure 2
Figure 2
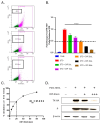
Establishing a functional unit for quantifying DIP-induced inhibition of STD PIV5 viral protein levels. (AD) A549 cells were mock-infected, infected with STD PIV5-TKHA at an MOI of 10, or co-infected with STD PIV5-TKHA and increasing doses of DIP-enriched stock (1, 5, 10, 20, 40, 80 μL). At 18 hpi, levels of TKHA were determined by cell staining with an anti-HA antibody and flow cytometry. (A) Representative TKHA staining scatterplot images comparing STD PIV5-TKHA-infected cells to co-infections of STD PIV5-TKHA with DIP-enriched stock at 20 and 80 μL doses. (B) Fold change (%) in TKHA-positive cells relative to STD PIV5-TKHA. (C) Relationship between amount of DIP-enriched stock and inhibition of STD PIV5-TKHA expression. The IC50 was determined to be 21.3 μL in a 60,000-cell population, defined as 1 Defective Interfering Unit (DI unit). (D) A549 cells were mock-infected, infected with STD PIV5-TKHA infected at an MOI of 10, or co-infected with STD PIV5-TKHA and DIP-enriched virus with 0.25 (low dose) or 1 (high dose) DI unit. At 18 hpi, cell lysates were analyzed by Western blot for levels of TKHA and the PIV5 P protein.
Figure 3
Figure 3
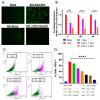
PIV5 DIPs suppress STD virus gene expression and reduce expression of PIV5 surface glycoproteins during coinfection. (A) A549 cells were mock-infected, or infected with STD PIV5-GFP at an MOI of 10, DIP-enriched stock (10 DI units) alone, or co-infected with STD PIV5-GFP and DIP-enriched stock (10 DI units). Cells were examined for GFP expression at 18 hpi with fluorescence (FL) microscopy (A). (B) A549 cells were mock-infected, or infected with STD PIV5, 1 DIU alone, or STD PIV5 and either 1 or 5 DIUs. At 18 hpi, RNA was isolated and analyzed by quantitative PCR analysis for levels of PIV5 F, HN and NP mRNA. Data represent the relative expression of each viral gene normalized to a GAPDH housekeeping gene. (C) Representative scatter plot images comparing PIV5 surface glycoprotein levels for mock-infected vs. STD PIV5 infected vs. STD PIV5 and DIU (0.25, 3) infected cells by flow cytometry (D) A549 cells were mock-infected, or infected with STD PIV5 alone, or STD PIV5 with increasing doses of DIUs (0.125, 0.25, 0.5, 1, 2, 3). At 18 hpi, cells were analyzed for surface levels of PIV5 proteins by flow cytometry. Data represent the percentage of cells in a population positive for the PIV5 glycoproteins. Values in all panels are the means of three replicates, with error bars representing standard deviation. **** indicates a p value < 0.0001.
Figure 4
Figure 4
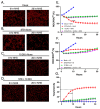
DIP-enriched PIV5 infections blocked C′-mediated killing of A549 lung epithelial cells. (AG) A549-NLR cells were mock-infected, STD PIV5 infected at an MOI of 10, infected with 10 DI units, or co-infected with PIV5 STD at an MOI of 10 and 10 DI units. At 18 hpi, each condition was treated with NHS at 10% as a source of C′ factors. (AD) Representative red fluorescent images of A549-NLR cells incubated with NHS were recorded using the IncuCyte instrument at 0 and 20 h post NHS addition. (E) Red object count (ROC) per well was quantified using the IncuCyte instrument and normalized to the ROC at time zero (ROC/ROCt0) when NHS was added, expressed as a percentage of time zero. (G) Percentage cytotoxicity was calculated from the data in panel (E,F) as described in Materials and Methods. Values are the mean of three replicates with error bars representing standard deviation; **** indicates when a p-value of <0.001 first appears in the time course comparing STD PIV5 infected to 10 DI unit or STD PIV5 + 10 DI unit infected cells incubated with NHS. This statistical significance was maintained throughout the remainder of the time course.
Figure 5
Figure 5
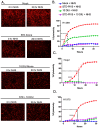
C′-mediated killing of PIV5-infected H1299, Hep2, and H1975 cells is reduced by co-infection with DIP-enriched stocks. (AD) H1299-NLR, Hep2-NLR, and H1975-NLR cells were mock-infected, or infected with STD PIV5 at an MOI of 10, 10 DI unit alone, or co-infected with STD PIV5 and 10 DI unit. At 18 hpi, samples were treated with 10% NHS as a source of C′ factors. (A) Representative red fluorescent images of H1299-NLR cells incubated with NHS were recorded using the IncuCyte instrument at 0 and 20 h after NHS addition. (BD) For each cell type, ROC recorded for samples treated with NHS was normalized to the ROC of cells in the absence of NHS as described for the data in Figure 4 above. Values are the mean of three replicates with error bars representing standard deviation; **** indicates when a p-value of <0.001 first appears in the time course comparing STD PIV5-infected and NHS-treated samples versus DIP alone and NHS-treated, or co-infected STD PIV5 + DIP and NHS-treated samples.
Figure 6
Figure 6
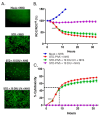
UV treatment of DIP-enriched PIV5 reduces interference with C′-mediated killing of STD PIV5-infected cells. (AC) DIP-enriched PIV5 stock was UV treated for 15 min prior to infections. A549-NLR cells were mock-infected, infected with STD PIV5 at an MOI of 10, or co-infected with STD PIV5 and 10 DI unit, either UV-treated or UV-untreated. (A) Representative images showing GFP expression of cells at 18 hpi with FL microscopy. (B) ROC for A549-NLR cells per well was quantified over the indicated times using the IncuCyte instrument and normalized to the ROC at time zero (ROC/ROCt0) when NHS was added. (C) Percentage cytotoxicity was calculated from the data in panel B as described in Materials and Methods. Values are expressed as a percentage of time zero, and are the mean of three replicates, with error bars representing standard deviation; **** indicates when a p value < 0.0001 first appeared on the time course, comparing STD PIV5 infection or STD PIV5 + UV-treated 10 DI unit infected cells incubated with NHS to STD PIV5 + 10 DI unit UV-untreated infected cells incubated with NHS.
Figure 7
Figure 7
DIP reduction in C′-mediated killing of PIV5-infected cells is independent of IFN induction. (A) A549 cells were mock-infected, or infected with STD PIV5 at an MOI of 10, or infected with DIP-enriched stock with increasing DI units (0.25, 0.75, 1.25). At 18 hpi, media were analyzed for IFN- β levels by ELISA. (B,C) A549 or A549-MAVS-KO-NLR cells were mock-infected, or infected with STD PIV5 an MOI of 10. At 18 hpi, GFP levels were monitored by fluorescent microscopy and media analyzed for levels of IFN-β by ELISA. (D) A549-MAVS-KO cells were infected with STD PIV5-TKHA alone at an MOI of 10, or coinfected with the indicated units of DIP-enriched stock along with STD PIV5-TKHA. Levels of intracellular TKHA were determined by flow cytometry at 18 hpi. (E,F) A549-MAVS-KO-NLR cells were mock-infected, or infected with STD PIV5 at an MOI of 10, 10 DI unit alone, or co-infected with STD PIV5 and 10 DI unit. ROC for A549-MAVS-KO-NLR cells per well was quantified using the IncuCyte instrument and normalized to the ROC at time zero (ROC/ROCt0) when NHS was added. (F) Percent cytotoxicity was calculated from the data in panel E as described in materials and methods. Values are expressed as a percentage of time zero and are the mean of three replicates, with error bars representing standard deviation; **** indicates when a p value < 0.0001 first appeared on the time course, comparing STD PIV5-infected cells to 10 DI unit or STD PIV5 + 10 DI unit-infected cells incubated with NHS.
Figure 8
Figure 8
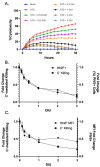
Relationship between the effect of DIP co-infection on PIV5 glycoprotein expression and C′-mediated killing. A549-NLR cells were co-infected with STD PIV5 and increasing doses of DI units (0.125, 0.25, 0.5, 1, 2, 3 units). At 18 hpi, cells were analyzed for PIV5 glycoprotein surface expression by flow cytometry. In parallel, cells at 18 hpi were treated with NHS and monitored by IncuCyte for C′-mediated killing post NHS addition. (A) Percentage cytotoxicity was calculated for increasing DI unit dosage as described in Materials and Methods. (B,C) This approach enabled the assessment of C′-mediated killing in cell populations exhibiting dose-dependent differences in glycoprotein expression at the time of NHS treatment. Across the DIU dosage titration (x-axis), the dual-axis plots illustrate the relationship between C′-mediated killing at 10 h post NHS addition (left y-axis) and either a fold change in the percentage of cells in the population that are positive for PIV5 glycoprotein surface expression relative to STD PIV5 (panel (B)) or MFI PIV5+ cells relative to STD PIV5 (panel (C)) (right y-axis).

Similar articles

Cited by

References

    1. Duffy S., Shackelton L.A., Holmes E.C. Rates of evolutionary change in viruses: Patterns and determinants. Nat. Rev. Genet. 2008;9:267–276. doi: 10.1038/nrg2323. - DOI - PubMed
    1. Chakrabartty I., Khan M., Mahanta S., Chopra H., Dhawan M., Choudhary O.P., Bibi S., Mohanta Y.K., Emran T.B. Comparative overview of emerging RNA viruses: Epidemiology, pathogenesis, diagnosis and current treatment. Ann. Med. Surg. 2022;79:103985. doi: 10.1016/j.amsu.2022.103985. - DOI - PMC - PubMed
    1. Woolhouse M.E.J., Brierley L. Epidemiological characteristics of human-infective RNA viruses. Sci. Data. 2018;5:180017. doi: 10.1038/sdata.2018.17. - DOI - PMC - PubMed
    1. Garcia-Blanco M.A., Ooi E.E., Sessions O.M. RNA Viruses, Pandemics and Anticipatory Preparedness. Viruses. 2022;14:2176. doi: 10.3390/v14102176. - DOI - PMC - PubMed
    1. Miranda M.N.S., Pingarilho M., Pimentel V., Torneri A., Seabra S.G., Libin P.J.K., Abecasis A.B. A Tale of Three Recent Pandemics: Influenza, HIV and SARS-CoV-2. Front. Microbiol. 2022;13:889643. doi: 10.3389/fmicb.2022.889643. - DOI - PMC - PubMed

Publication types

MeSH terms

Substances

LinkOut - more resources