. 2025 Mar 28;17(4):491.
doi: 10.3390/v17040491.

In Silico and In Vitro Studies of the Approved Antibiotic Ceftaroline Fosamil and Its Metabolites as Inhibitors of SARS-CoV-2 Replication

Affiliations

In Silico and In Vitro Studies of the Approved Antibiotic Ceftaroline Fosamil and Its Metabolites as Inhibitors of SARS-CoV-2 Replication

Cássia Delgado et al. Viruses. .

Abstract

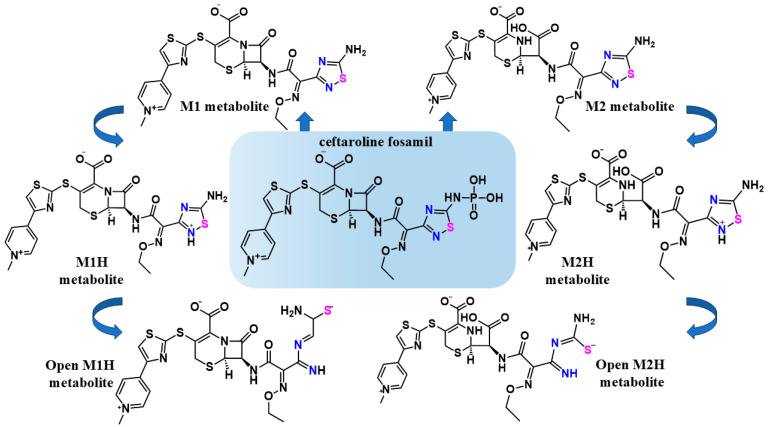
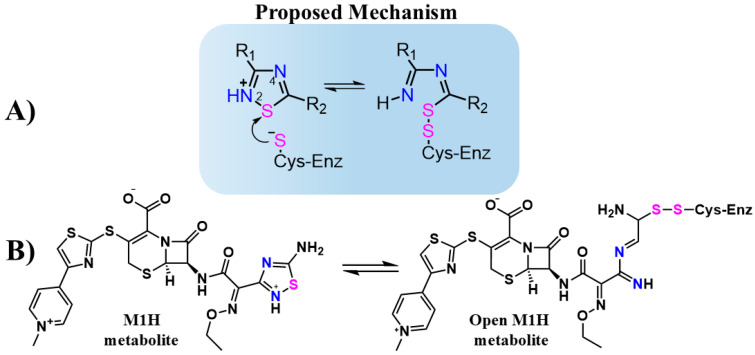
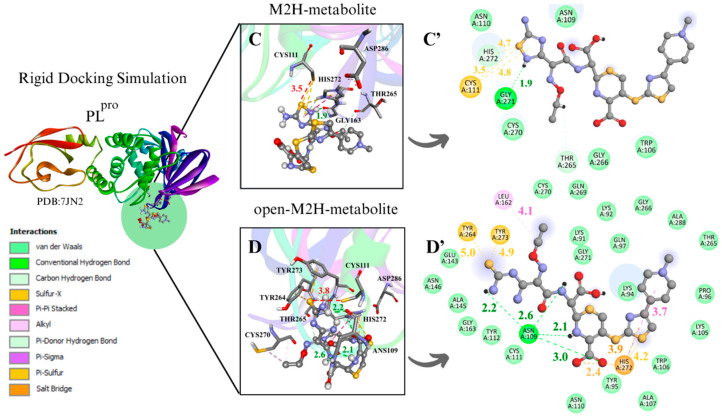
The SARS-CoV-2 proteases Mpro and PLpro are critical targets for antiviral drug development for the treatment of COVID-19. The 1,2,4-thiadiazole functional group is an inhibitor of cysteine proteases, such as papain and cathepsins. This chemical moiety is also present in ceftaroline fosamil (CF), an FDA-approved fifth-generation cephalosporin antibiotic. This study investigates the interactions between CF, its primary metabolites (M1 is dephosphorylated CF and M2 is an opened β-lactam ring) and derivatives (protonated M1H and M2H), and its open 1,2,4-thiadiazole rings derivatives (open-M1H and open-M2H) with SARS-CoV-2 proteases and evaluates CF's effects on in vitro viral replication. In silico analyses (molecular docking and molecular dynamics (MD) simulations) demonstrated that CF and its metabolites are potential inhibitors of PLpro and Mpro. Docking analysis indicated that the majority of the ligands were more stable with Mpro than PLpro; however, in vitro biochemical analysis indicated PLpro as the preferred target for CF. CF inhibited viral replication in the human Calu-3 cell model at submicromolar concentrations when added to cell culture medium at 12 h. Our results suggest that CF should be evaluated as a potential repurposing agent for COVID-19, considering not only viral proteases but also other viral targets and relevant cellular pathways. Additionally, the reactivity of sulfur in the 1,2,4-thiadiazole moiety warrants further exploration for the development of viral protease inhibitors.

Keywords: SARS-CoV-2; ceftaroline fosamil; cysteine proteases; drug repurposing; molecular docking; molecular dynamics; viral replication inhibition.


Conflict of interest statement

The authors declare no conflicts of interest.

Figures

Figure 2
Figure 2
The chemical structures of the antibiotic CF and its metabolic scheme evaluated in this work. The structures of CF, its M1 metabolite, and its M2 metabolite were obtained from the DrugBank database [43]. The structures of M1H and M2H metabolites, were used to support the proposed mechanism for the inhibition of cysteine proteases by the 1,2,4-thiadiazole functional group [35]. The structures of open-M1H and open-M2H metabolites were determined, taking into account the proposed mechanism for the inhibition of cysteine proteases by the 1,2,4-thiadiazole functional group, after disruption of the aromatic ring and the interaction with the active sites. The 1,2,4-thiadiazole heteroatoms Sulfur (pink) and Nitrogen (blue)_are highlighted to emphasizes the proposed mechanism before and after the heterocycle opening.
Figure 1
Figure 1
(A) Structure and proposed inhibitory mechanism of cysteine enzymes (Cys-Enz) by 1,2,4-thiadiazoles molecules. R1 and R2 are organic groups. (B) Proposed inhibitory mechanism of Cys-Enz by CF metabolite (M1H) through covalent bond formation (S-S). The 1,2,4-thiadiazole heteroatoms Sulfur (pink) and Nitrogen (blue) are highlighted to emphasizes the proposed mechanism before and after the heterocycle opening.
Figure 3
Figure 3
The target cysteinyl residues in the SARS-CoV-2 Mpro active site (Cys145) and PLpro active site (Cys111) are shown. (A) The Mpro monomer, with Cys and His residues, deprotonated and protonated, respectively. (B) PLpro, with His and Cys residues of the active site, protonated and deprotonated, respectively.
Figure 4
Figure 4
Rigid docking focused on active site with Cys and His charged in most favorable S···S interaction conformer. Mpro result compilation of 3D and 2D diagrams, with interaction distances between active site environment and ligands. (A) M1H metabolite 3D scheme, ∆G = −7.8 kcal·mol−1. (A’) M1H metabolite 2D scheme. (B) Open-M1H metabolite 3D, ∆G = −7.4 kcam·mol−1. (B’) Open-M1H metabolite 2D scheme. (C) M2H metabolite 3D scheme, ∆G = −7.5 kcal·mol−1. (C’) M2H metabolite 2D scheme. (D) Open-M2H metabolite 3D, ∆G = −6.9 kcal·mol−1. (D’) Open-M2H metabolite 2D scheme. Legend of intermolecular interactions is shown in bottom left corner. Distances are in Å. In order to optimize visualization of interaction of ligand with main amino acids of active site, some amino acids in environment are only highlighted in 2D visualization.
Figure 4
Figure 4
Rigid docking focused on active site with Cys and His charged in most favorable S···S interaction conformer. Mpro result compilation of 3D and 2D diagrams, with interaction distances between active site environment and ligands. (A) M1H metabolite 3D scheme, ∆G = −7.8 kcal·mol−1. (A’) M1H metabolite 2D scheme. (B) Open-M1H metabolite 3D, ∆G = −7.4 kcam·mol−1. (B’) Open-M1H metabolite 2D scheme. (C) M2H metabolite 3D scheme, ∆G = −7.5 kcal·mol−1. (C’) M2H metabolite 2D scheme. (D) Open-M2H metabolite 3D, ∆G = −6.9 kcal·mol−1. (D’) Open-M2H metabolite 2D scheme. Legend of intermolecular interactions is shown in bottom left corner. Distances are in Å. In order to optimize visualization of interaction of ligand with main amino acids of active site, some amino acids in environment are only highlighted in 2D visualization.
Figure 5
Figure 5
Rigid docking focused in the active site with Cys and His charged in the most favorable S···S interaction conformer. PLpro result compilation of 3D and 2D diagrams, with the interaction distances between the active site environment and the ligands. (A) M1H metabolite 3D scheme, ∆G = −5.6. (A’) M1H metabolite 2D scheme. (B) Open-M1H metabolite 3D, ∆G = −5.8. (B’) Open-M1H metabolite 2D scheme. (C) M2H metabolite 3D scheme, ∆G = −5.3. (C’) M2H metabolite 2D scheme. (D) Open-M2H metabolite 3D, ∆G = −5.4. (D’) Open-M2H metabolite 2D scheme. The legend of the intermolecular interactions is shown in the bottom left corner. Distances are in Å. In order to optimize the visualization of the interaction of the ligand with the main amino acids of the active site, some amino acids in the environment are only highlighted in the 2D visualization.
Figure 5
Figure 5
Rigid docking focused in the active site with Cys and His charged in the most favorable S···S interaction conformer. PLpro result compilation of 3D and 2D diagrams, with the interaction distances between the active site environment and the ligands. (A) M1H metabolite 3D scheme, ∆G = −5.6. (A’) M1H metabolite 2D scheme. (B) Open-M1H metabolite 3D, ∆G = −5.8. (B’) Open-M1H metabolite 2D scheme. (C) M2H metabolite 3D scheme, ∆G = −5.3. (C’) M2H metabolite 2D scheme. (D) Open-M2H metabolite 3D, ∆G = −5.4. (D’) Open-M2H metabolite 2D scheme. The legend of the intermolecular interactions is shown in the bottom left corner. Distances are in Å. In order to optimize the visualization of the interaction of the ligand with the main amino acids of the active site, some amino acids in the environment are only highlighted in the 2D visualization.
Figure 6
Figure 6
Frame-to-frame evolution of the trajectories for each of the four metabolites analyzed in the conformational dynamics for Mpro (top) and PLpro (below) within the protein’s binding pocket over a 0 ns, 50 ns, and 100 ns production time. The simulation area for each protein is represented by a gray cloud, with only the catalytic dyad and triad in each enzyme’s binding pocket highlighted (Mpro Cys145, His41/PLpro Cys111, His272, Asp286) using a ball-and-stick representation. The metabolites M1H, M2H, open-M1H, and open-M2H are depicted as colorful sticks. The complete timeframe figures are available in the SI (Figures S13 and S14).
Figure 7
Figure 7
The root mean square deviation (RMSD) of the α (alpha) carbon atoms of the complexes in (A) Mpro and (B) PLpro over a 100 ns production time. The RMSD values are calculated with respect to each metabolite’s conformation at 0 ns production time. The root mean square fluctuation (RMSF) of (C) Mpro and (D) PLpro residues in response to binding different metabolite states over a 100 ns molecular dynamics simulation. The plot displays the evolution of the RMSD and RMSF for four metabolite complexes: M2H (blue), M1H (red), open-M1H (green), and open-M2H (black).
Figure 8
Figure 8
Dose–response curves for CF tested against SARS-CoV-2 (A) PLpro and (B) Mpro recombinant enzyme analysis. All experiments were performed in triplicate, and the data are expressed as the mean ± standard deviation.
Figure 9
Figure 9
The effect of CF on the Calu-3 cells viability. The Calu-3 cells were exposed to different concentrations (0.8, 1.6, 3.1, 6.3, 12.5, 25, 50, 100, and 200 µM) of the drug for 72 h, at 37 °C and 5% CO2. Cell viability was determined using the methylene blue staining procedure (n = 3).
Figure 10
Figure 10
The antiviral effect of CF on SARS-CoV-2 replication in Calu-3 cells. Calu-3 cells infected with an MOI of 0.01 (A,B) or 0.1 (C) and exposed to CF under a semi-log concentration curve (0.1, 0.316, 1, 3.16, and 10 µM) were treated without (A) or with (B,C) pulses of treatment in different times post infection (12, 24, 36, and 48 h). The data represent the results of four independent experiments with four technical replicates. The value of R2 ranged from 0.90 to 0.95 (MOI 0.1) and from 0.92 to 0.98 (MOI 0.01).

Similar articles

References

    1. Jeronimo P.M.C., Aksenen C.F., Duarte I.O., Lins R.D., Miyajima F. Evolutionary deletions within the SARS-CoV-2 genome as signature trends for virus fitness and adaptation. J. Virol. 2024;98:e01404-23. - PMC - PubMed
    1. Mukherjee R., Dikic I. Proteases of SARS Coronaviruses. Encycl. Cell Biol. 2023;1:930
    1. Buttle D.J., Mort J.S. Encyclopedia of Biological Chemistry: Second Edition. Academic Press; Cambridge, MA, USA: 2013. Cysteine Proteases; pp. 589–592. - DOI
    1. Pišlar A., Mitrović A., Sabotič J., Fonović U.P., Nanut M.P., Jakoš T., Senjor E., Kos J. The role of cysteine peptidases in coronavirus cell entry and replication: The therapeutic potential of cathepsin inhibitors. PLoS Pathog. 2020;16:e1009013. - PMC - PubMed
    1. Gorbalenya A.E., Snijder E.J. Viral cysteine proteinases. Perspect. Drug Discov. Des. 1996;6:64. doi: 10.1007/BF02174046. - DOI - PMC - PubMed

Publication types

MeSH terms

LinkOut - more resources