. 2025 Mar 30;17(4):500.
doi: 10.3390/v17040500.

Severe Acute Respiratory Syndrome Coronavirus 2 Variant Infection Dynamics and Pathogenesis in Transgenic K18-h ACE2 and Inbred Immunocompetent C57BL/6J Mice

Affiliations

Severe Acute Respiratory Syndrome Coronavirus 2 Variant Infection Dynamics and Pathogenesis in Transgenic K18-h ACE2 and Inbred Immunocompetent C57BL/6J Mice

Hongwei Liu et al. Viruses. .

Abstract

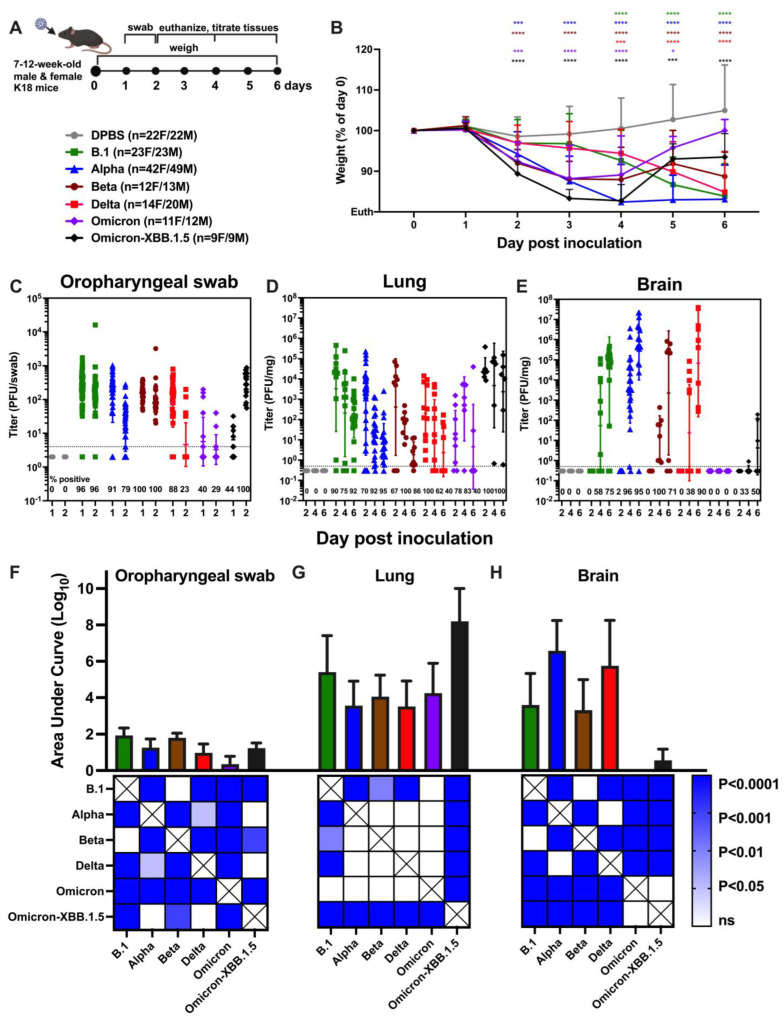
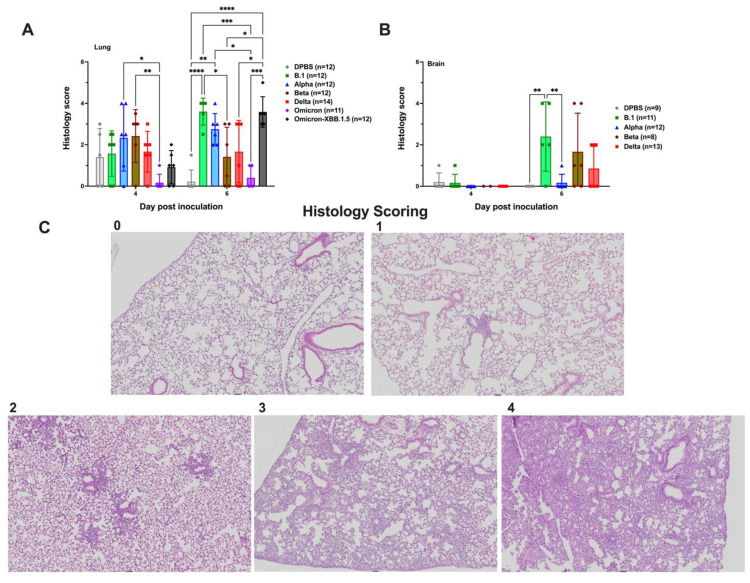
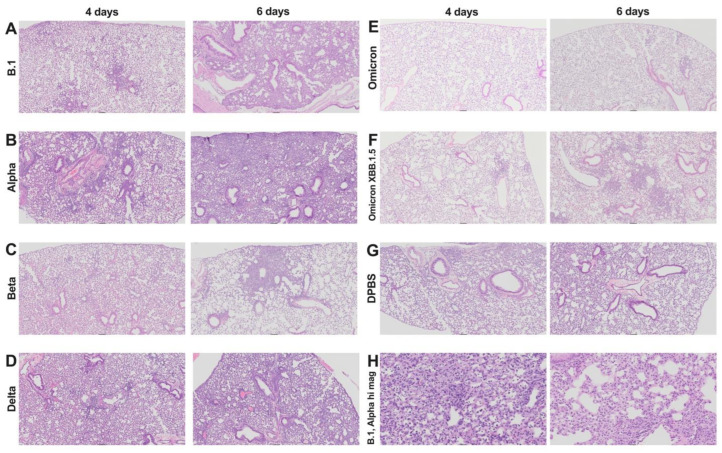
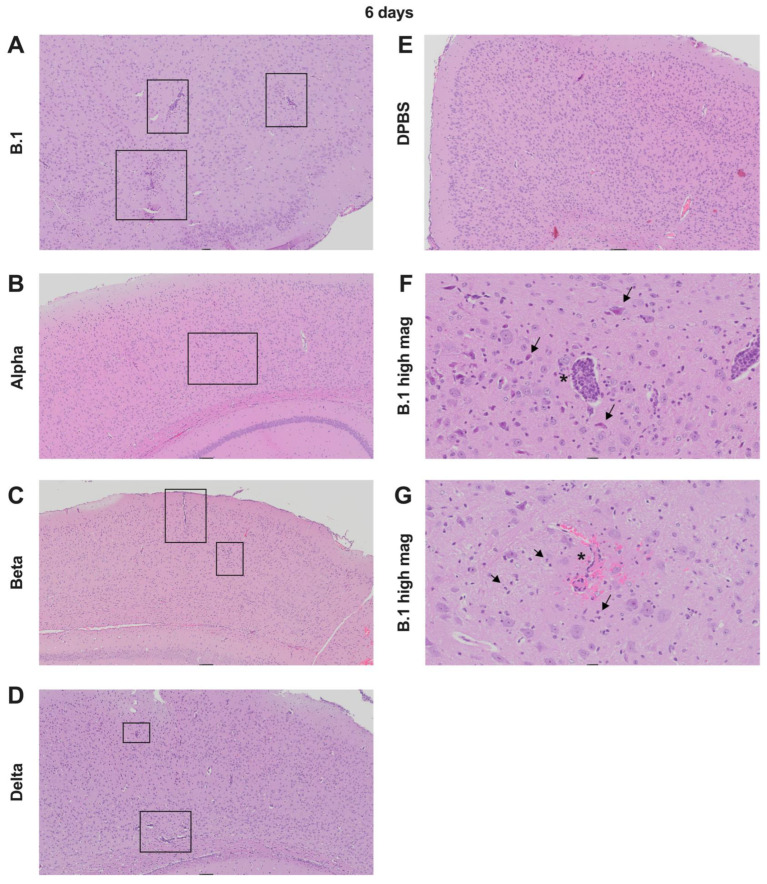
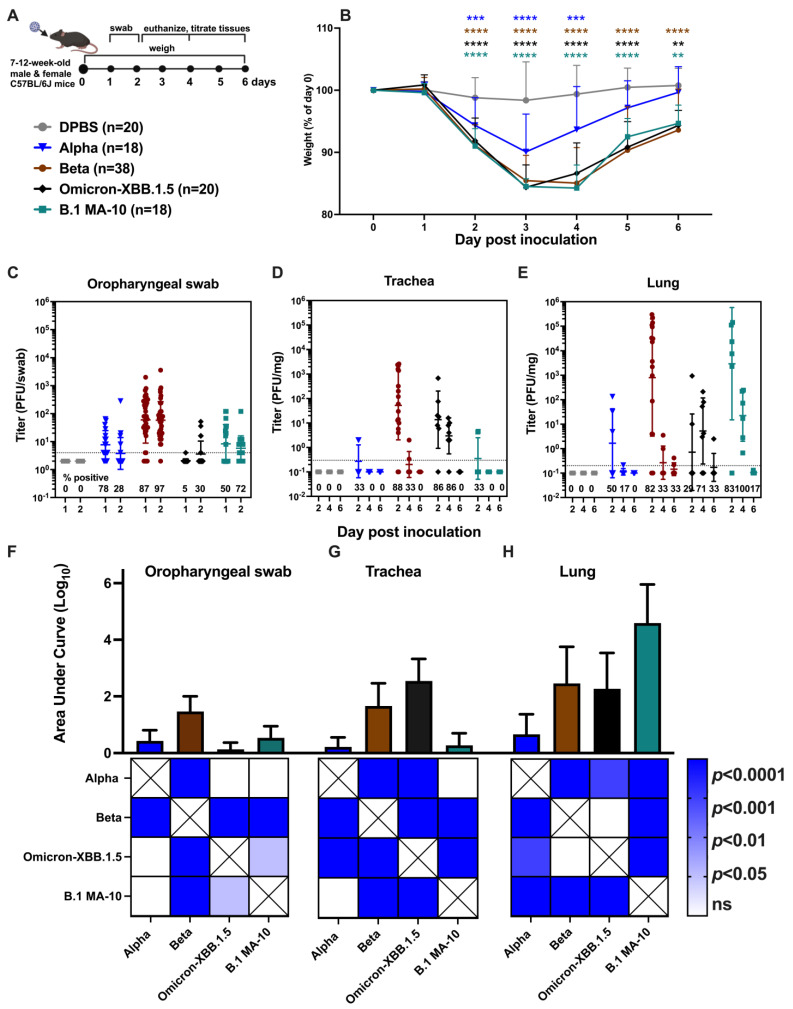
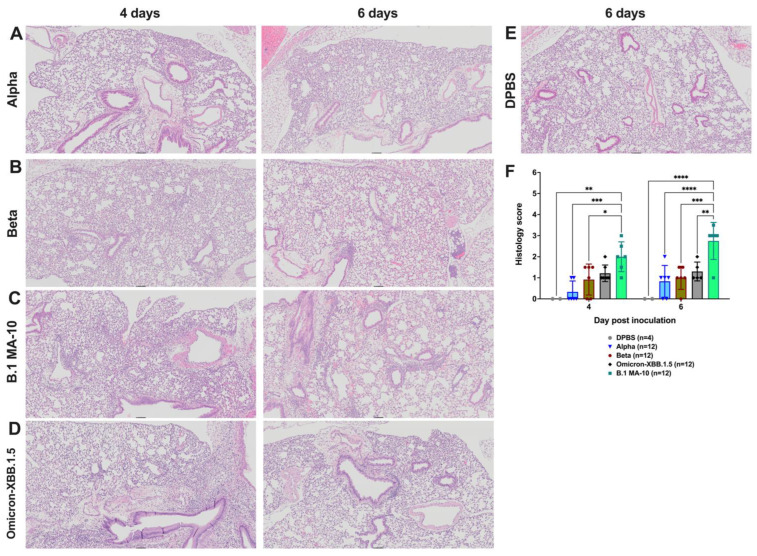
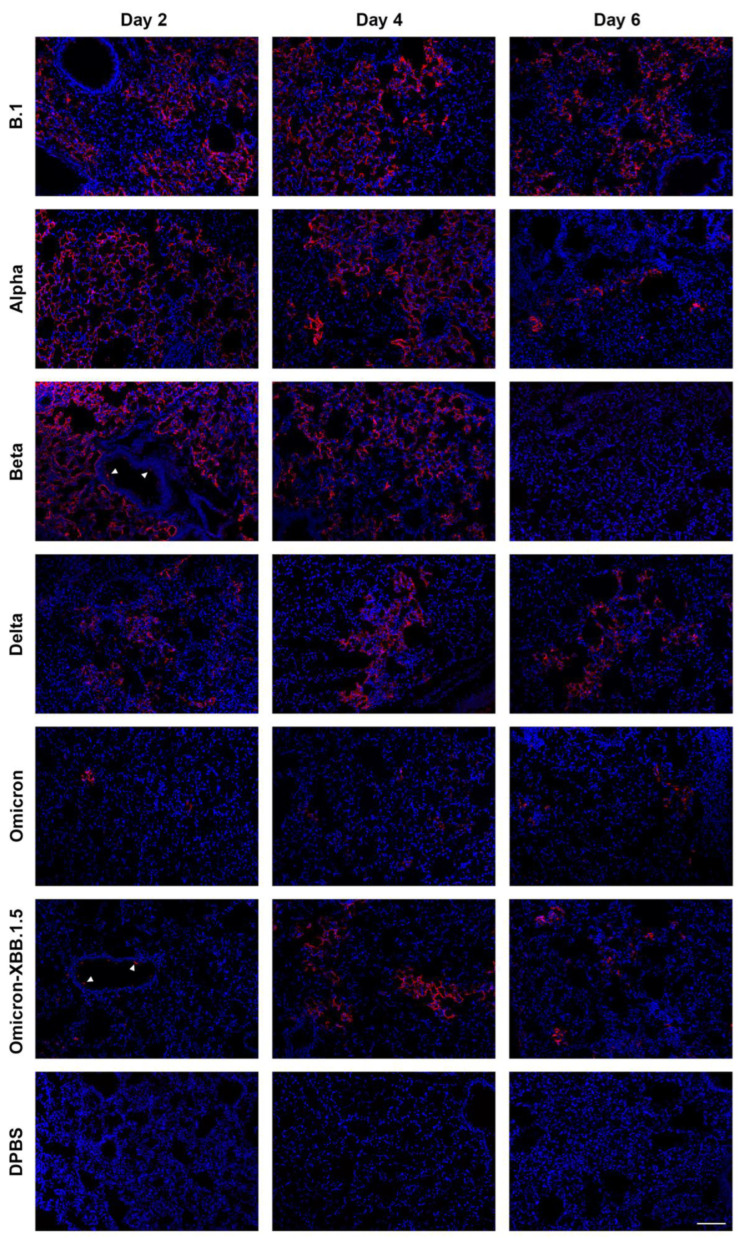
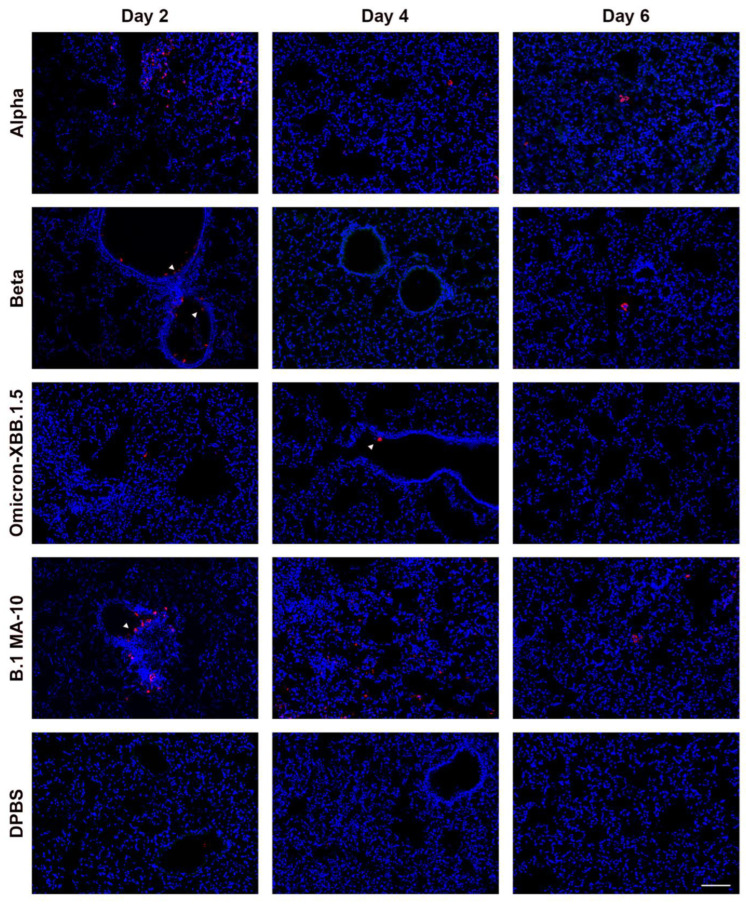
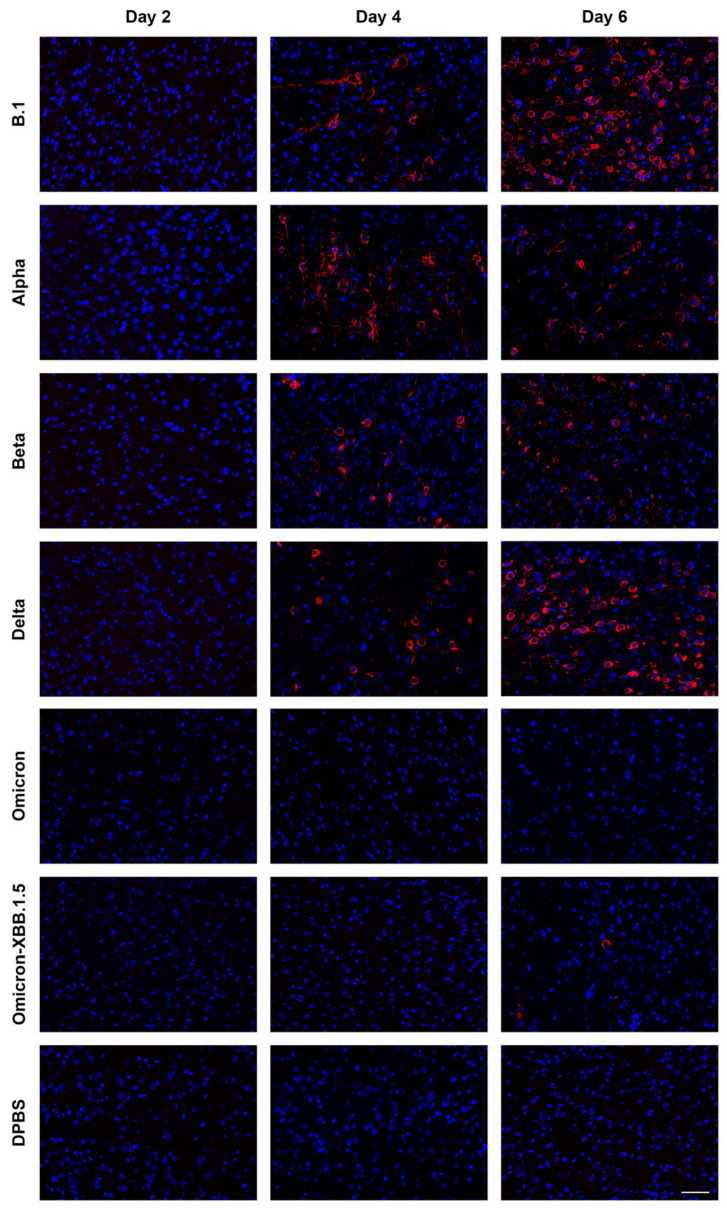
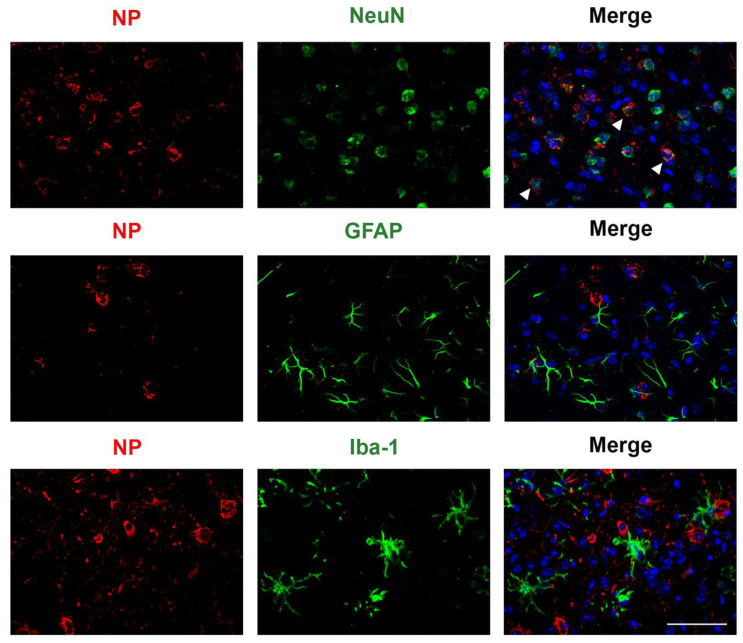
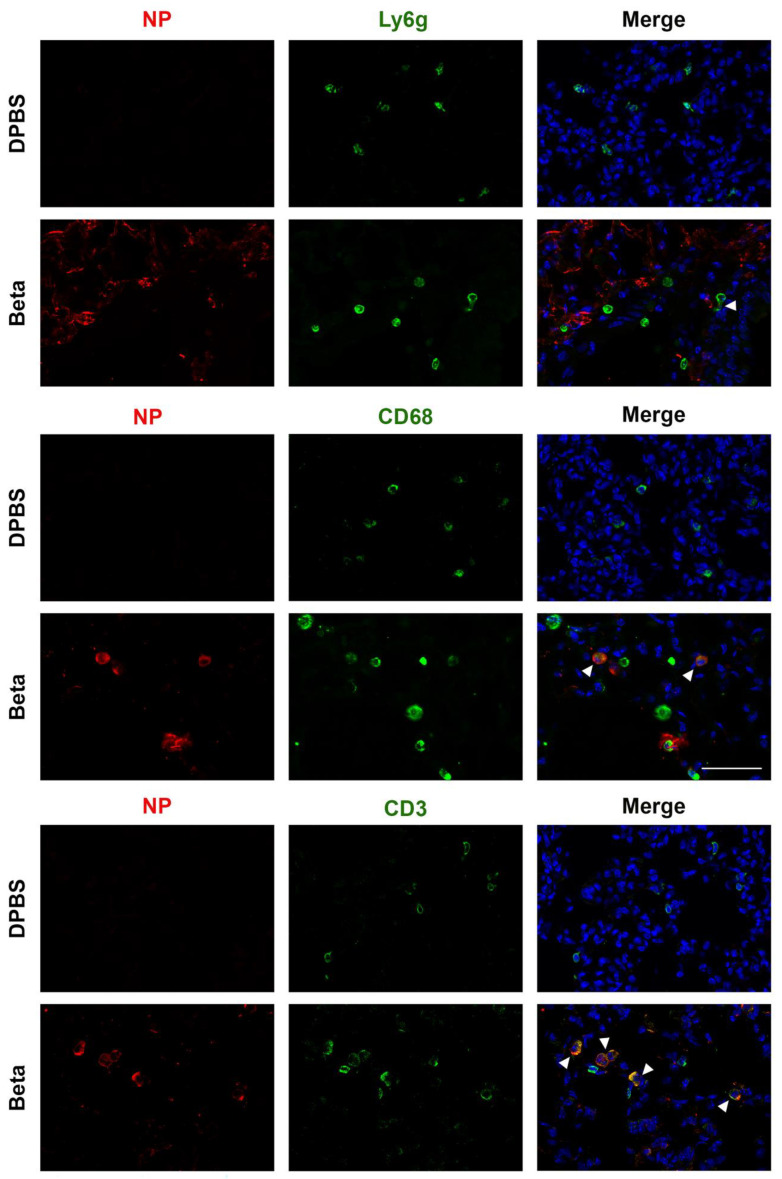
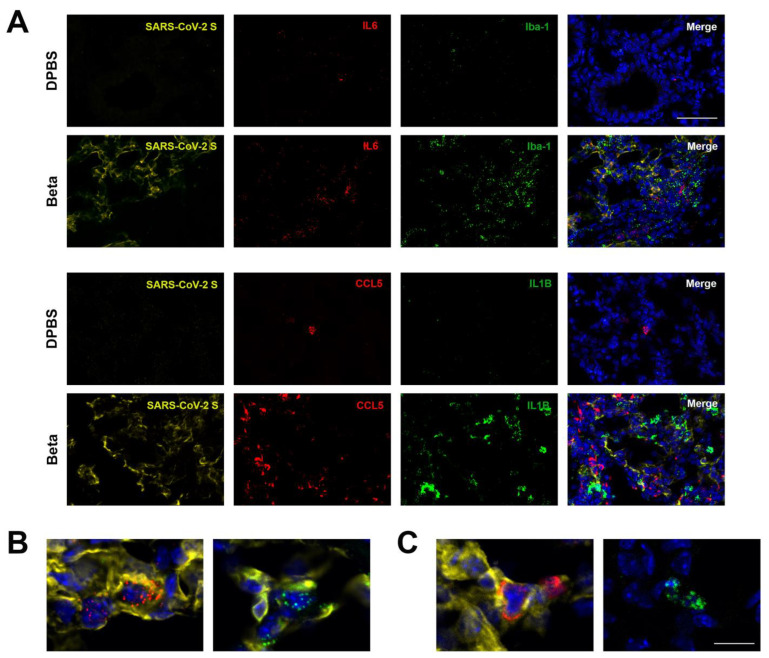
The global impact of the COVID-19 pandemic, caused by severe acute respiratory syndrome coronavirus 2 (SARS-CoV-2), persists in part due to the emergence of new variants. Understanding variant-specific infection dynamics and pathogenesis in murine models is crucial for identifying phenotypic changes and guiding the development of countermeasures. To address the limitations of earlier studies that investigated only a few variants or used small sample sizes, we evaluated clinical disease, infection kinetics, viral titers, cellular localization, and histopathologic changes in the lungs and brains of transgenic B6.Cg-Tg(K18-ACE2)2Prlmn/J ("K18") and corresponding genetic control (C57BL/6J) mice expressing human angiotensin-converting enzyme 2 (hACE2). Six SARS-CoV-2 variants were assessed: B.1 (WA1-like), alpha, beta, delta, omicron, and omicron XBB.1.5, using cohorts of ≥18 mice. Following intranasal inoculation with B.1, alpha, beta, or delta variants, K18 mice experienced rapid weight loss and reached euthanasia criteria by 5-6 days post-inoculation (dpi). In contrast, K18 mice inoculated with both omicron variants recovered to their starting weight within 4-6 dpi. Infectious SARS-CoV-2 was detected in the oropharynx at 1 and2 dpi, in the lungs at 2, 4, and 6 dpi, and in the brain at 4 and 6 dpi for all variants except omicron. SARS-CoV-2 nucleoprotein was detected, and interstitial pneumonia of varying severity was observed in K18 mice infected with all variants. Brain lesions were identified in mice infected with the B.1, beta, and delta variants 6 dpi. As K18 mice express hACE2 in the brain-a feature not present in humans-we also compared infection dynamics of three variants to those of a mouse-adapted WA1 strain in C57BL/6J mice lacking the human ACE2 gene. C57BL/6J mice did not experience lethal disease, exhibited milder pneumonia, and had no evidence of neuroinvasion despite similar infection kinetics to K18 mice. These findings demonstrate contrasting phenotypes across the two models and reduced tropism and pathology of omicron compared to earlier variants in both models. This comprehensive analysis of SARS-CoV-2 variants in two mouse models provides valuable insights for model and variant selection for future studies.

Keywords: C57BL/6J mice; COVID-19; K18 mice; SARS-CoV-2; human ACE2 receptor-expressing mice; infection dynamics; mouse model; pathogenesis; transgenic mice.


Conflict of interest statement

The authors declare no conflicts of interest.

Figures

Figure 1
Figure 1
SARS-CoV-2 variants produce varying degrees of weight loss and infectious virus in the oropharynx, lung, and brain of K18 mice. (A) Experimental design: Seven to–12-week-old male and female mice of approximate equal sex ratio were inoculated intranasally with DPBS (mock) or 104 PFU of different SARS-CoV-2 variants. Mice were monitored for disease signs and weighed daily, and the oropharyngeal cavity was swabbed on 1 and 2 days post inoculation (dpi). Subsets of mice were euthanized at 2, 4, and 6 dpi. (B) Mean weight change represented as a percentage of weight of each mouse on 0 dpi, prior to inoculation. Error bars show standard deviations. Colored symbols above weight graphs match virus groups and show significant differences in mean body weight compared to mock (2-way ANOVA), where p < 0.05 is shown as *; 0.001 as ***; and 0.0001 as ****. Infectious SARS-CoV-2 titrated from (C) oropharyngeal swabs collected 1 and 2 dpi, and from necropsy samples in (D) lung and (E) brain on 2, 4, and 6 dpi, quantified by plaque assays. Symbols represent measurements from individual animals, horizontal lines show the geometric mean, and error bars represent the geometric standard deviation. Numbers below the dotted limit-of-detection line indicate the percentage of mice with a detectable SARS-CoV-2 titer. The limit of detection of the assays was 4 PFU/swab for oropharyngeal swab and 0.5 PFU/mg for lung and brain. (F) SARS-CoV-2 infection kinetics expressed as area under the infection curve (AUC) in oropharyngeal swabs, (G) lungs and (H) brains. Colors in the squares underneath panels (FH) show differences in mean AUC by strain analyzed using one-way ANOVA tests, where the darker the color, the smaller the p value. Each sample was titrated once in 3–6 serial 10-fold dilutions. Mice were from different replicate experiments as follows: DPBS: 11 experiments; B.1: 6 experiments; B.1.1.7 [alpha]: 6 experiments); B.1.351 [beta]: 2 experiments; B.1.617.2 [delta]: 4 experiments; B.1.1.529 [omicron]: 2 experiments; B.1.1.529-XBB.1.5 [omicron-XBB.1.5]: 1 experiment. The infographic in A was generated using Biorender 2025.
Figure 2
Figure 2
SARS-CoV-2 variants produce varied levels of histopathological changes in the lung and brain of K18 mice. Mean histology scores in (A) lung and (B) brain 4 and 6 dpi. Differences in histology scores across groups were analyzed by 2-way ANOVA (lungs) and nonparametric Mann–Whitney U tests (brain); only significant differences are shown, with p < 0.05 as *; <0.01 as **; <0.001 as ***; <0.0001 as ****. (C) Pulmonary lesions for all SARS-CoV-2 variants in affected mice were consistent with interstitial pneumonia and characterized by decreasing air space, increasing cellularity, and increasing thickness of alveolar septa resulting in histologic scores ranging from 1 to 4.
Figure 3
Figure 3
Representative images of histopathological features in lungs of K18 mice infected with SARS-CoV-2 variants at 4 and 6 dpi illustrating a spectrum of presentations ranging from no lesions to severe inflammation. Images were chosen based on the mean histologic score for each variant/day combination. Images in A-G show H&E-stained lung at 5× magnification. Key features at this magnification include loss of alveolar (clear) space, perivascular and/or peribronchiolar mononuclear aggregates, and interstitial and/or alveolar cellular infiltrates. (A) B.1, 4 dpi (score 2); 6 dpi (score 4). (B) Alpha, 4 dpi (score 2.5) and 6 dpi (score 4). (C) Beta, 4 dpi (score 3) and 6 dpi (score 3). (D) Delta, 4 dpi (score 1.5) and 6 dpi (score 3). (E) Omicron, 4 dpi (score 0) and 6 dpi (score 1). (F) Omicron-XBB.1.5, 4 dpi (score 1) and 6 dpi (score 3). (G) DPBS, 4 dpi (score 1.5) and 6 dpi (score 0). (H) Higher-magnification (20×) lung histologic score 4 at 4 dpi (B.1) and 6 dpi (alpha). Inflammation transitions from neutrophilic (4 dpi) to histiocytic (6 dpi).
Figure 4
Figure 4
Representative histopathology of affected brain tissues in K18 mice infected with different SARS-CoV-2 variants at 6 dpi. Images in A-E are H&E-stained cortex at 5× magnification. Boxes highlight affected regions of inflammation. Key lesions at this magnification include perivascular lymphoplasmacytic cuffs and gliosis (increased cellularity). (A) B.1 (score 4); (B) alpha (score 1); (C) beta (score 4); (D) delta (score 2); (E) DPBS (score 0). (F,G): B.1 (score 4) key lesions at 20× magnification from separate sections shown in other panels. (F) Neuronal necrosis (arrows) and perivascular cuffing (asterisk) in a mouse infected with B.1 at 6 dpi. (G) Neutrophilic infiltrates (arrows) and fibrin thrombus with microhemorrhage (asterisk) in a mouse infected with B.1 at 6 dpi.
Figure 5
Figure 5
SARS-CoV-2 variants produce varying degrees of weight loss and infectious virus in the oropharynx, trachea, and lung of C57BL/6J mice. (A) Experimental design: Seven to12-week-old male and female mice of equal sex ratio were inoculated intranasally with DPBS or 105 PFU of alpha, beta, omicron-XBB.1.5, or 104 PFU of mouse-adapted B.1 (B.1 MA-10) SARS-CoV-2. (B) Mean weight change represented as a percentage of weight of each mouse on 0 dpi, prior to inoculation. Error bars show standard deviations. Colored symbols above weight graphs match virus groups and show significant differences in mean body weight compared to mock (2-way ANOVA), where p < 0.01 is shown as **; 0.001 as ***; and 0.0001 as ****. Infectious SARS-CoV-2 titrated from (C) oropharyngeal swabs collected 1 and 2 dpi, and (D) trachea and (E) lung on 2, 4, and 6 dpi, as quantified by plaque assay. Each symbol shows measurements from individual animals; the horizontal lines show geometric means, and error bars represent geometric standard deviations. The numbers below the dotted limit-of-detection line indicate the percentage of mice with a detectable SARS-CoV-2 titer. The limit of detection of the assays was 4 PFU/swab and 0.5 PFU/mg for lung and 0.5 PFU/mg brain. (FH) SARS-CoV-2 infection kinetics expressed as areas under the infection curve (AUC) in the oropharyngeal swabs, lungs, and brains. Colors in the squares underneath panel F show differences in mean AUC by strain analyzed using one-way ANOVA tests, where the darker the color, the smaller the p value. Data shown are from 3 replicate experiments. The infographic in A was generated using Biorender.
Figure 6
Figure 6
SARS-CoV-2 variants produce varied levels of pathological changes in the lungs of C57BL/6J mice. Images were chosen based on the mean histologic score for each variant/day combination. Pulmonary lesions for all SARS-CoV-2 variants in affected mice are consistent with interstitial pneumonia manifesting as decreasing air space, increasing cellularity, and increasing thickness of alveolar septa that produced histologic scores ranging from 1 to 4. All images are taken at 5× magnification. Key features at this magnification include loss of alveolar (clear) space, perivascular and/or peribronchiolar mononuclear aggregates, and multifocal to diffuse interstitial cellular infiltrates. (A) Alpha at 4 dpi (score 1) and 6 dpi (score 1). (B) Beta at 4 dpi (score 1.5) and 6 dpi (score 1.5). (C) B.1 MA-10 at 4 dpi (score 2) and 6 dpi (score 3). (D) Omicron-XBB.1.5 at 4 dpi (score 2) and 6 dpi (score 2). (E) DPBS at 6 dpi (score 0). (F) Lung histology scores. Differences in histologic scores were analyzed by 2-way ANOVA, p < 0.05 as *; <0.01 as **; <0.001 as ***; <0.0001 as ****. Assessment of lung histological scores was made from images viewed at 20× magnification.
Figure 7
Figure 7
Different SARS-CoV-2 variants show varied levels of infection in the lung of K18 mice at 2, 4 and 6 dpi detected by nucleocapsid protein (NP) immunostaining. Representative NP (red) signal distribution, counterstained by DAPI (blue). Arrowheads indicate rare bronchial epithelial cell infection with SARS-CoV-2. Scale bar shows 100 μm.
Figure 8
Figure 8
Different SARS-CoV-2 variants show varied levels of infection in the lung of C57BL/6J mice at 2, 4 and 6 dpi detected by nucleocapsid protein (NP) immunostaining. Representative NP (red) signal distribution, counterstained by DAPI (blue). Arrowheads indicate rare bronchial epithelial cell infection with SARS-CoV-2. Scale bar shows 100 μm.
Figure 9
Figure 9
SARS-CoV-2 variants show varied levels of infection in the coronal section of the brain of K18 mice at 2, 4 and 6 dpi detected by nucleocapsid protein (NP) immunostaining. Representative NP (red) signal distribution, counterstained by DAPI (blue), for B.1, alpha, beta, delta, omicron, and omicron-XBB.1.5 at 2, 4 and 6 dpi. Scale bar is 50 μm.
Figure 10
Figure 10
SARS-CoV-2 infection of a K18 mouse with beta shows infections in neurons in the cortex via immunofluorescence at 2 dpi. DAPI-stained nuclei are shown in blue; SARS-CoV-2 NP is in red; NeuN+ neurons, GFAP+ astrocytes, and Iba-1+ microglia are shown in green. Arrowheads show examples of NP+ overlap with neurons. Scale bar is 50 μm.
Figure 11
Figure 11
SARS-CoV-2 beta infection of the lung of a K18 mouse produces immune cell markers detected via immunofluorescence at 2 dpi. DAPI-stained nuclei are shown in blue, with SARS-CoV-2 NP in red; Ly6g-positive neutrophils, CD68-positive macrophages, and CD3-positive T cells are detected (green). Arrowheads indicate NP overlap with immune cells. Scale bar is 50 μm.
Figure 12
Figure 12
SARS-CoV-2 beta infection of the lung of a mouse shows cytokine and macrophage expression in the lung at 2 dpi. Images were captured using RNAscope via in situ hybridization. (AC) SARS-CoV-2 spike (S)-positive cells are detected in yellow, cytokines CCL5 and IL-6 are in red, Iba-1+ macrophages are in green, and IL1β is in green. DAPI-stained nuclei are shown in blue. (B) Higher-magnification images of co-localization of signal for IL-6+ and S-positive cells (left) and (right) Iba1+ and S-positive cell. (B) Higher-magnification images of co-localization of signal for CCL5+ and S-positive cells (left) and of Il1B+ and S-negative cells (right). Scale bar shows (A) 50 μm and (B,C) 20 μm.

Similar articles

References

    1. COVID-19 Cases|WHO COVID-19 Dashboard. [(accessed on 22 October 2024)]. Available online: https://data.who.int/dashboards/covid19/cases.
    1. Walensky R.P., Walke H.T., Fauci A.S. SARS-CoV-2 Variants of Concern in the United States-Challenges and Opportunities. JAMA. 2021;325:1037–1038. doi: 10.1001/jama.2021.2294. - DOI - PMC - PubMed
    1. Lamers M.M., Haagmans B.L. SARS-CoV-2 Pathogenesis. Nat. Rev. Microbiol. 2022;20:270–284. doi: 10.1038/s41579-022-00713-0. - DOI - PubMed
    1. World Health Organization . Post COVID-19 Condition (Long COVID) World Health Organization; Geneva, Switzerland: 2025.
    1. Tarrés-Freixas F., Trinité B., Pons-Grífols A., Romero-Durana M., Riveira-Muñoz E., Ávila-Nieto C., Pérez M., Garcia-Vidal E., Perez-Zsolt D., Muñoz-Basagoiti J., et al. Heterogeneous Infectivity and Pathogenesis of SARS-CoV-2 Variants Beta, Delta and Omicron in Transgenic K18-hACE2 and Wildtype Mice. Front. Microbiol. 2022;13:840757. doi: 10.3389/fmicb.2022.840757. - DOI - PMC - PubMed

Publication types

Substances

Supplementary concepts