. 2025 Apr 8;17(4):546.
doi: 10.3390/v17040546.

Implementing Symptom-Based Predictive Models for Early Diagnosis of Pediatric Respiratory Viral Infections

Affiliations

Implementing Symptom-Based Predictive Models for Early Diagnosis of Pediatric Respiratory Viral Infections

Antoni Soriano-Arandes et al. Viruses. .

Abstract

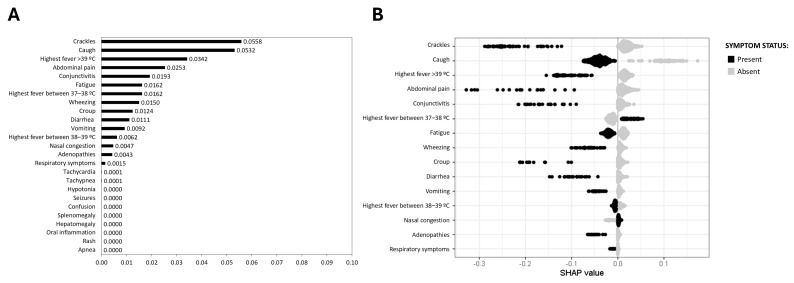
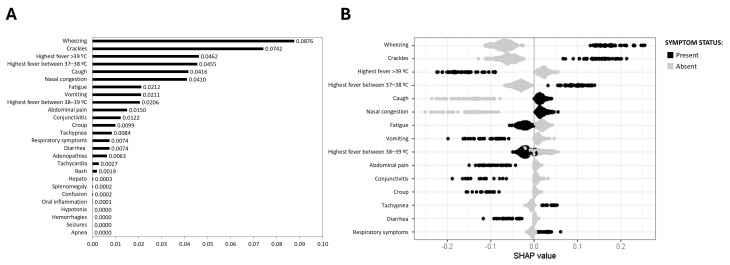
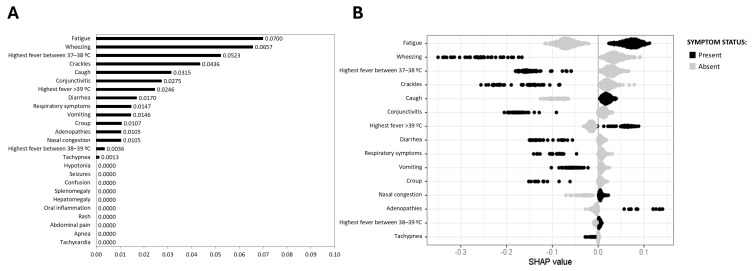
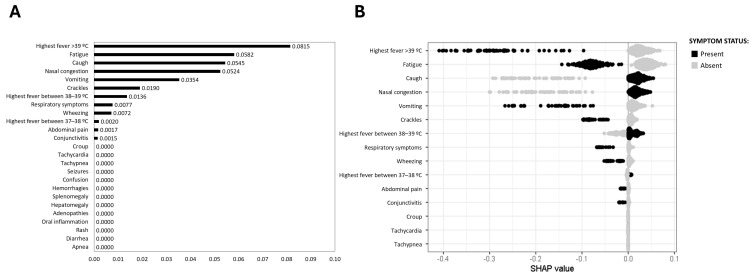
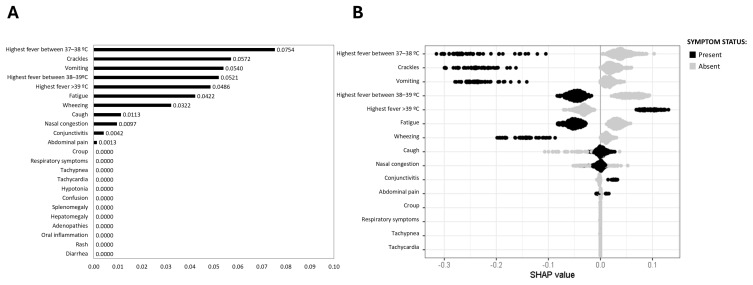
(1) Background: Respiratory viral infections, including those caused by SARS-CoV-2, respiratory syncytial virus (RSV), influenza viruses, rhinovirus, and adenovirus, are major causes of acute respiratory infections (ARIs) in children. Symptom-based predictive models are valuable tools for expediting diagnoses, particularly in primary care settings. This study assessed the effectiveness of machine learning-based models in estimating infection probabilities for these common pediatric respiratory viruses, using symptom data. (2) Methods: Data were collected from 868 children with ARI symptoms evaluated across 14 primary care centers, members of COPEDICAT (Coronavirus Pediatria Catalunya), from October 2021 to October 2023. Random forest and boosting models with 10-fold cross-validation were used, applying SMOTE-NC to address class imbalance. Model performance was evaluated via area under the curve (AUC), sensitivity, specificity, and Shapley additive explanations (SHAP) values for feature importance. (3) Results: The model performed better for RSV (AUC: 0.81, sensitivity: 0.64, specificity: 0.77) and influenza viruses (AUC: 0.71, sensitivity: 0.70, specificity: 0.59) and effectively ruled out SARS-CoV-2 based on symptom absence, such as crackles and wheezing. Predictive performance was lower for non-enveloped viruses like rhinovirus and adenovirus, due to their nonspecific symptom profiles. SHAP analysis identified key symptoms patterns for each virus. (4) Conclusions: The study demonstrated that symptom-based predictive models effectively identify pediatric respiratory infections, with notable accuracy for those caused by RSV, SARS-CoV-2, and influenza viruses.

Keywords: acute respiratory infection; pediatric care; respiratory virus infections; symptom-based predictive modeling; triage.


Conflict of interest statement

The authors declare no conflicts of interest. The funders had no role in the design of the study; in the collection, analyses, or interpretation of data; in the writing of the manuscript; or in the decision to publish the results.

Figures

Figure 1
Figure 1
SHAP values for SARS-CoV-2 prediction. (A) Mean SHAP value barplot; (B) SHAP beeswarm plot. The black points represent the presence of a symptom associated with the disease, and the grey points represent their absence. Higher positive SHAP values indicate an increased probability of the disease, illustrating the relationship between specific symptoms and the likelihood of SARS-CoV-2 infection.
Figure 2
Figure 2
SHAP values for RSV prediction. (A) Mean SHAP value barplot; (B) SHAP beeswarm plot. The black points represent the presence of a symptom associated with the disease, and the grey points represent their absence. Higher positive SHAP values indicate an increased probability of the disease, illustrating the relationship between specific symptoms and the likelihood of RSV infection.
Figure 3
Figure 3
SHAP values for influenza (A + B) prediction. (A) Mean SHAP value barplot; (B) SHAP beeswarm plot. The black points represent the presence of a symptom associated with the disease, and the grey points represent their absence. Higher positive SHAP values indicate an increased probability of the disease, illustrating the relationship between specific symptoms and the likelihood of influenza (A + B) infection.
Figure 4
Figure 4
SHAP values for rhinovirus prediction. (A) Mean SHAP value barplot; (B) SHAP beeswarm plot. The black points represent the presence of a symptom associated with the disease, and the grey points represent their absence. Higher positive SHAP values indicate an increased probability of the disease, illustrating the relationship between specific symptoms and the likelihood of rhinovirus infection.
Figure 5
Figure 5
SHAP values for adenovirus prediction. (A) Mean SHAP value barplot; (B) SHAP beeswarm plot. The black points represent the presence of a symptom associated with the disease, and the grey points represent their absence. Higher positive SHAP values indicate an increased probability of the disease, illustrating the relationship between specific symptoms and the likelihood of adenovirus infection.

Similar articles

References

    1. Litwin C.M., Bosley J.G. Seasonality and prevalence of respiratory pathogens detected by multiplex PCR at a tertiary care medical center. Arch. Virol. 2014;159:65–72. doi: 10.1007/s00705-013-1794-4. - DOI - PMC - PubMed
    1. Pieren D.K.J., Boer M.C., de Wit J. The adaptive immune system in early life: The shift makes it count. Front. Immunol. 2022;13:1031924. doi: 10.3389/fimmu.2022.1031924. - DOI - PMC - PubMed
    1. Zhu G., Xu D., Zhang Y., Wang T., Zhang L., Gu W., Shen M. Epidemiological characteristics of four common respiratory viral infections in children. Virol. J. 2021;18:10. doi: 10.1186/s12985-020-01475-y. - DOI - PMC - PubMed
    1. Koonin E.V., Krupovic M., Agol V.I. The Baltimore Classification of Viruses 50 Years Later: How Does It Stand in the Light of Virus Evolution? Microbiol. Mol. Biol. Rev. 2021;85:e0005321. doi: 10.1128/MMBR.00053-21. - DOI - PMC - PubMed
    1. Mahy B.W. The Evolution and Emergence of RNA Viruses. Emerg. Infect. Dis. 2010;16:899. doi: 10.3201/eid1605.100164. - DOI

Publication types

LinkOut - more resources