. 2025 Apr 14;17(4):567.
doi: 10.3390/v17040567.

Evaluation of Different Machine Learning Approaches to Predict Antigenic Distance Among Newcastle Disease Virus (NDV) Strains

Affiliations

Evaluation of Different Machine Learning Approaches to Predict Antigenic Distance Among Newcastle Disease Virus (NDV) Strains

Giovanni Franzo et al. Viruses. .

Abstract

Newcastle disease virus (NDV) continues to present a significant challenge for vaccination due to its rapid evolution and the emergence of new variants. Although molecular and sequence data are now quickly and inexpensively produced, genetic distance rarely serves as a good proxy for cross-protection, while experimental studies to assess antigenic differences are time consuming and resource intensive. In response to these challenges, this study explores and compares several machine learning (ML) methods to predict the antigenic distance between NDV strains as determined by hemagglutination-inhibition (HI) assays. By analyzing F and HN gene sequences alongside corresponding amino acid features, we developed predictive models aimed at estimating antigenic distances. Among the models evaluated, the random forest (RF) approach outperformed traditional linear models, achieving a predictive accuracy with an R2 value of 0.723 compared to only 0.051 for linear models based on genetic distance alone. This significant improvement demonstrates the usefulness of applying flexible ML approaches as a rapid and reliable tool for vaccine selection, minimizing the need for labor-intensive experimental trials. Moreover, the flexibility of this ML framework holds promise for application to other infectious diseases in both animals and humans, particularly in scenarios where rapid response and ethical constraints limit conventional experimental approaches.

Keywords: NDV; antigenic cartography; cross-protection; hemagglutination inhibition; machine learning; sequencing.


Conflict of interest statement

The authors declare no conflicts of interest.

Figures

Figure 1
Figure 1
Antigenic map of NDVs based on HI data. Names of antigens (depicted as dots) and sera (depicted as squares) were excluded from the map to improve readability. Colors have been assigned to each genotype (nomenclature according to Dimitrov et al., [18]) to visualize antigenic relatedness between genotypes. The vertical and horizontal axes both represent antigenic distance, and, because only the relative positions of antigens and antisera can be determined, the orientation of the map within these axes is free. The spacing between grid lines is 1 unit of antigenic distance corresponding to a twofold dilution of antiserum in the HI assay.
Figure 2
Figure 2
Antigenic map of NDVs based on MN data. Dots represent antigens and squares represent sera of individual immunized birds. The same color has been used for viruses and homologous antisera; superposition of two sera is represented by darker color of the square. The spacing between grid lines is 1 unit of antigenic distance corresponding to a two-fold dilution of antiserum in the MN assay.
Figure 3
Figure 3
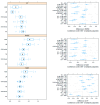
Boxplot performance metrics obtained through cross-validation for different methods, based on the F dataset (left). The solid, hollow dots, represent the median value. Differences in performance parameters between methods pairs (right). The average difference and the confidence interval, corrected for multiple comparisons, indicative of statistical significance, are reported.
Figure 4
Figure 4
Boxplot performance metrics obtained through cross-validation for different methods, based on the HN dataset (left). The solid, hollow dots, represent the median value. Differences in performance parameters between methods pairs (right). The average difference and the confidence interval, corrected for multiple comparisons, indicative of statistical significance, are reported.
Figure 5
Figure 5
Boxplot performance metrics obtained through cross-validation for different methods, based on the Merged dataset (left). The solid, hollow dots, represent the median value. Differences in performance parameters between methods pairs (right). The average difference and the confidence interval, corrected for multiple comparisons, indicative of statistical significance, are reported.

Similar articles

References

    1. Plotkin S. History of Vaccination. Proc. Natl. Acad. Sci. USA. 2014;111:12283–12287. doi: 10.1073/pnas.1400472111. - DOI - PMC - PubMed
    1. Lombard M., Pastoret P.P., Moulin A.M. A Brief History of Vaccines and Vaccination. Rev. Sci. Tech. 2007;26:29–48. doi: 10.20506/rst.26.1.1724. - DOI - PubMed
    1. Read A.F., Mackinnon M.J. Pathogen Evolution in a Vaccinated World. Evol. Health Dis. 2010;2:139–152. doi: 10.1093/acprof:oso/9780199207466.003.0011. - DOI
    1. Tannous L.K., Barlow G., Metcalfe N.H. A Short Clinical Review of Vaccination against Measles. JRSM Open. 2014;5:2054270414523408. doi: 10.1177/2054270414523408. - DOI - PMC - PubMed
    1. Hegerle N., Guiso N. Bordetella Pertussis and Pertactin-Deficient Clinical Isolates: Lessons for Pertussis Vaccines. Expert Rev. Vaccines. 2014;13:1135–1146. doi: 10.1586/14760584.2014.932254. - DOI - PubMed

Publication types

Associated data

LinkOut - more resources