. 2025 Apr 17;17(4):580.
doi: 10.3390/v17040580.

Expression Profiles of lncRNAs and mRNAs in the Mouse Brain Infected with Pseudorabies Virus: A Bioinformatic Analysis

Affiliations

Expression Profiles of lncRNAs and mRNAs in the Mouse Brain Infected with Pseudorabies Virus: A Bioinformatic Analysis

Yanwei Li et al. Viruses. .

Abstract

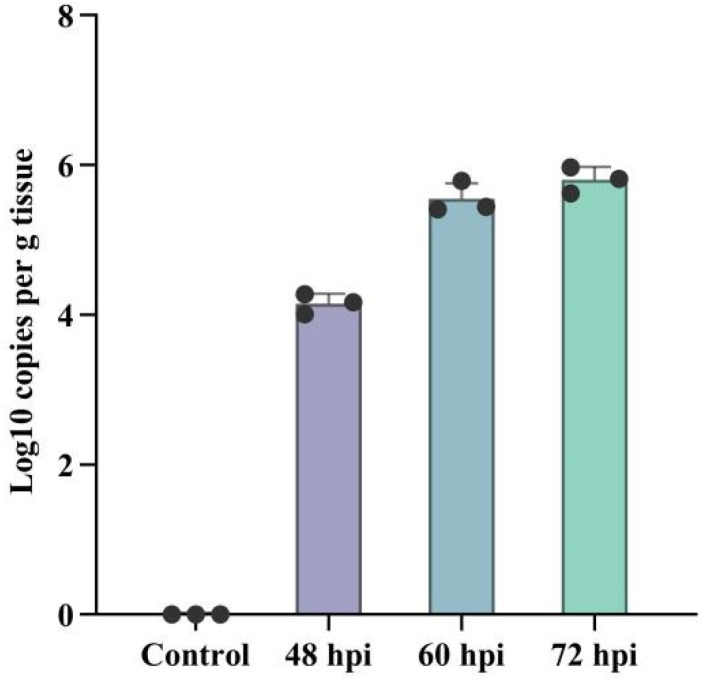
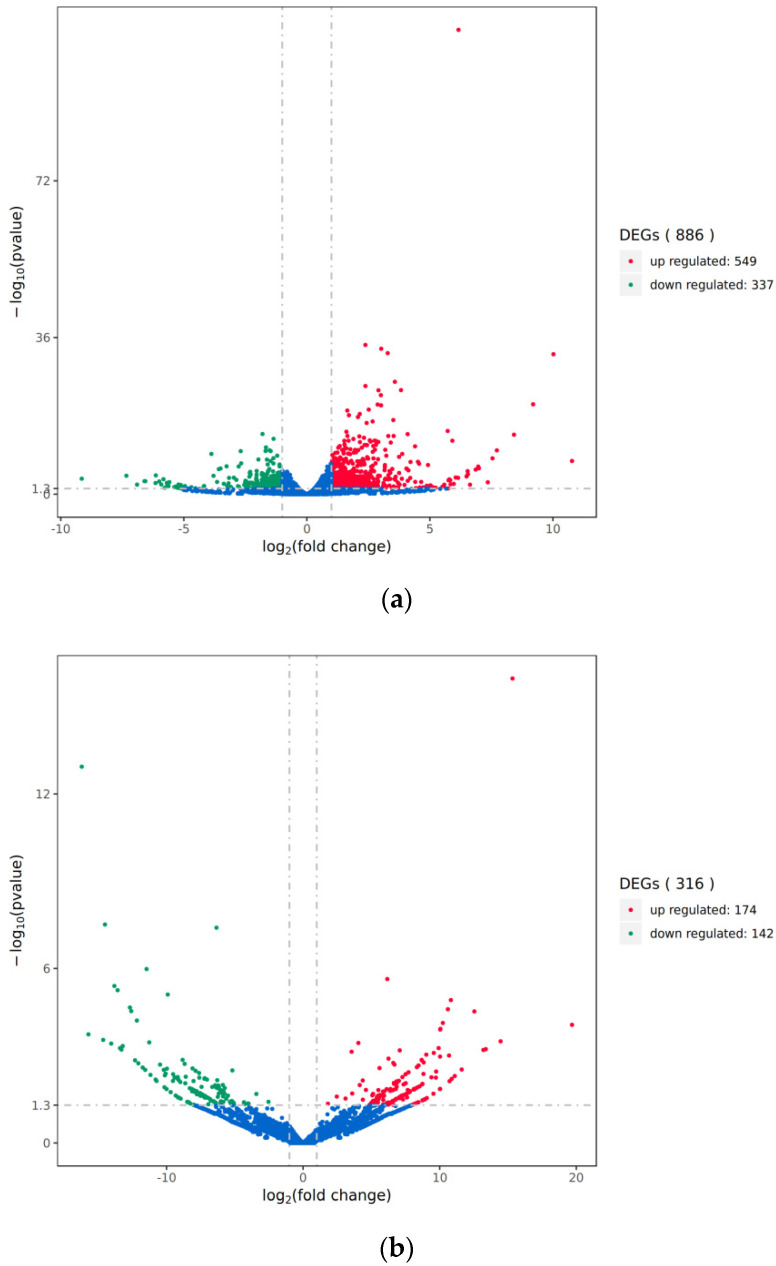
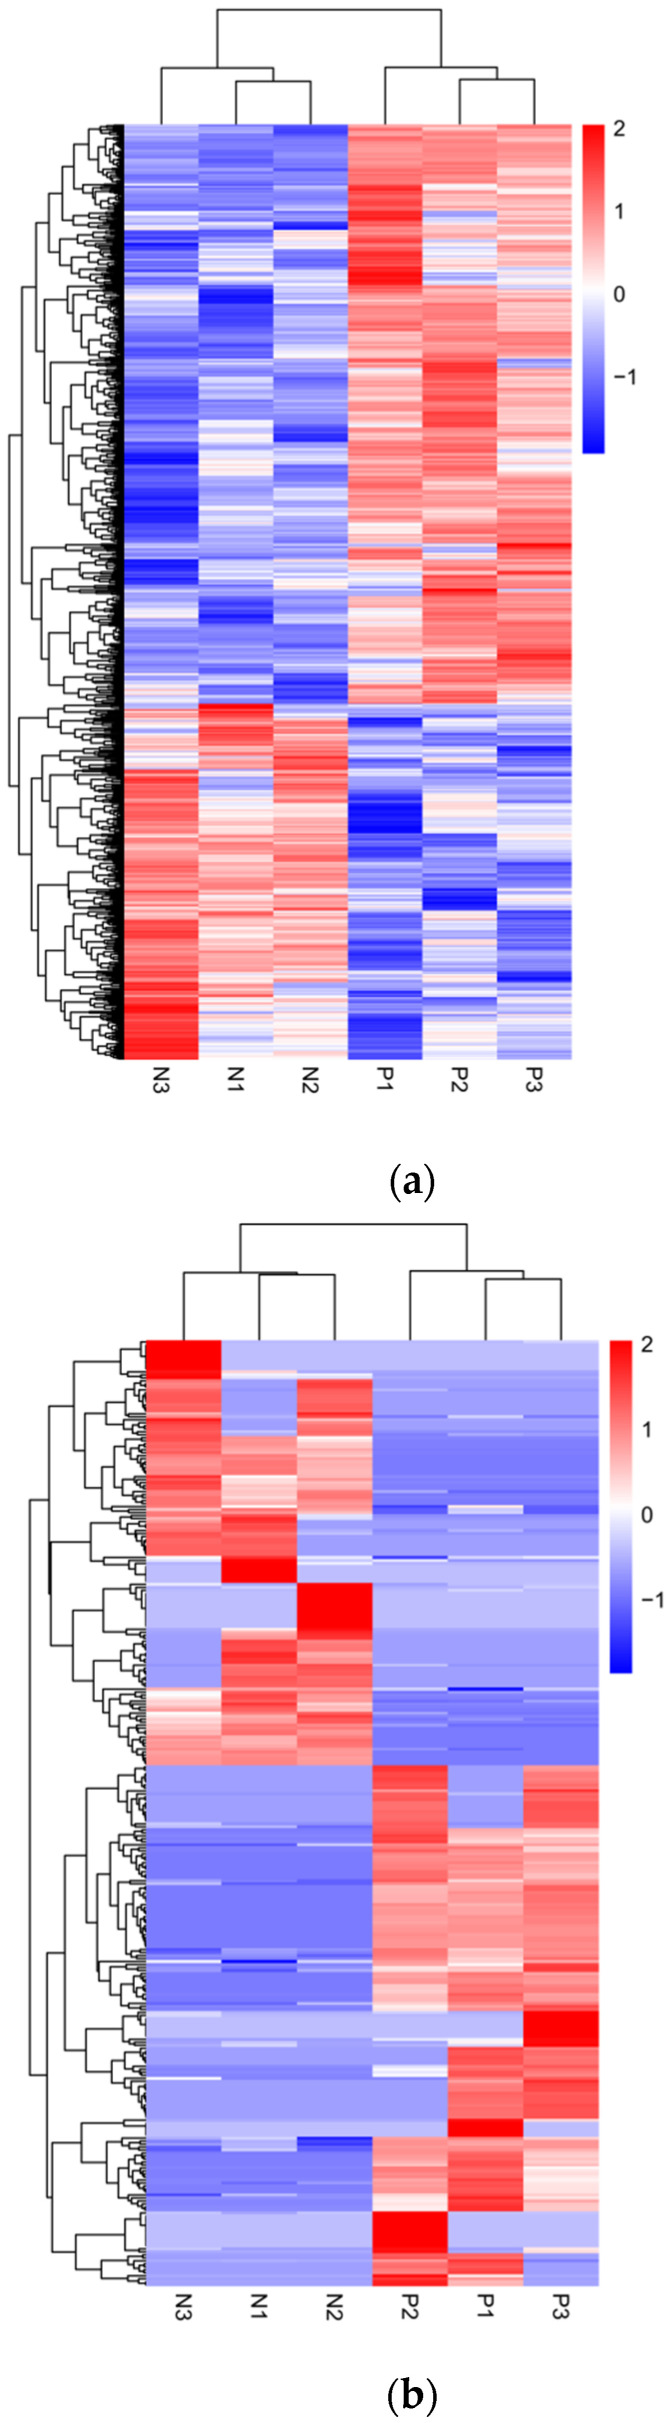
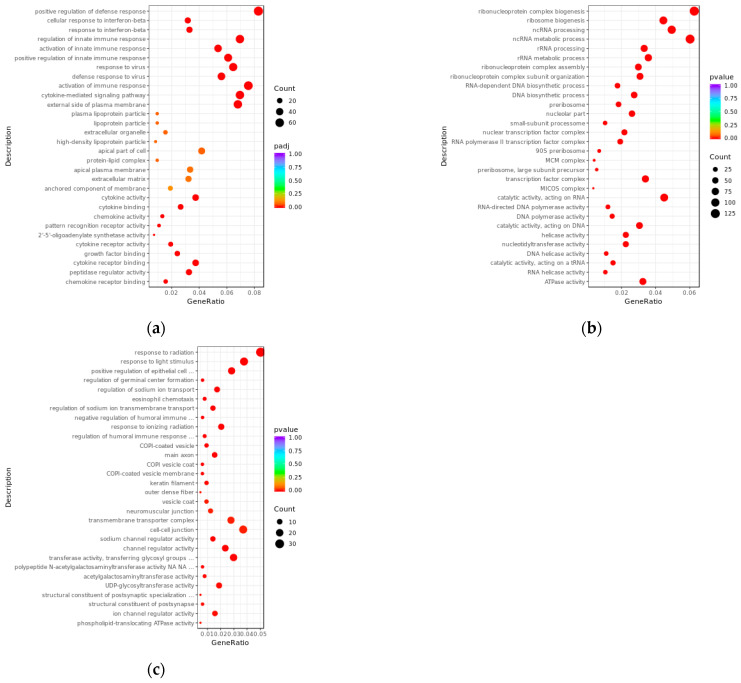
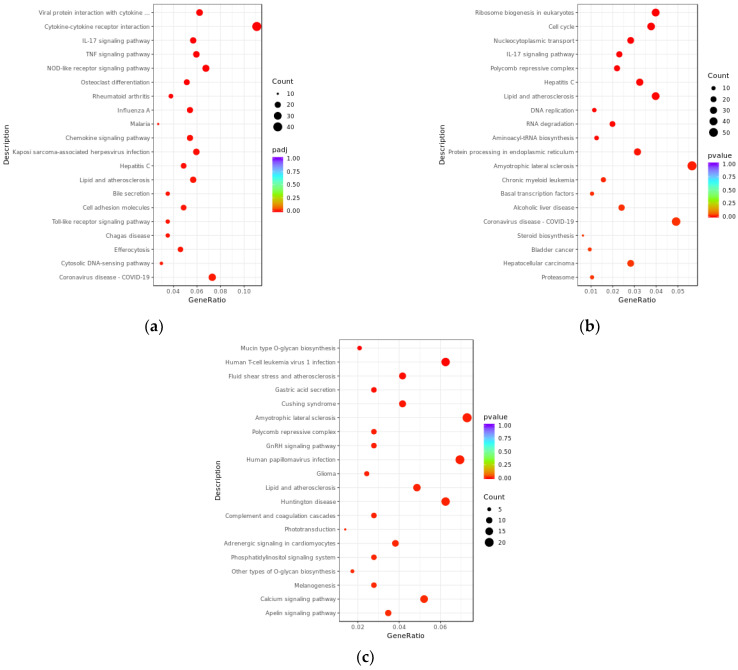
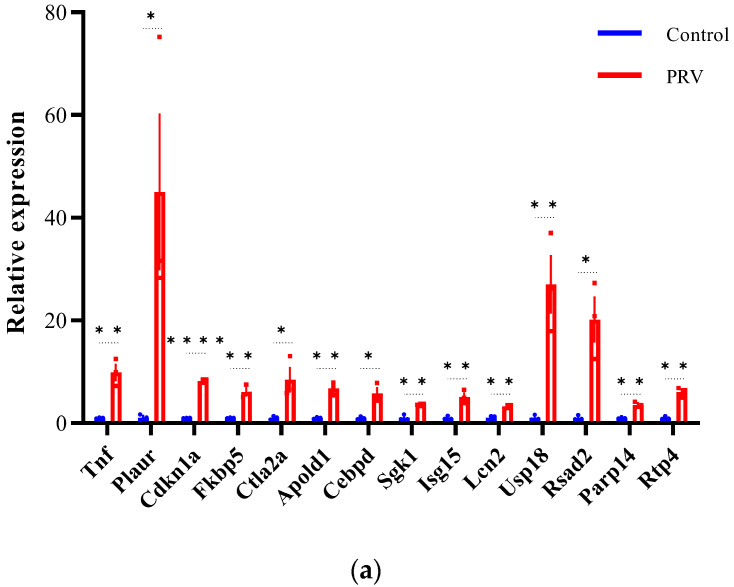
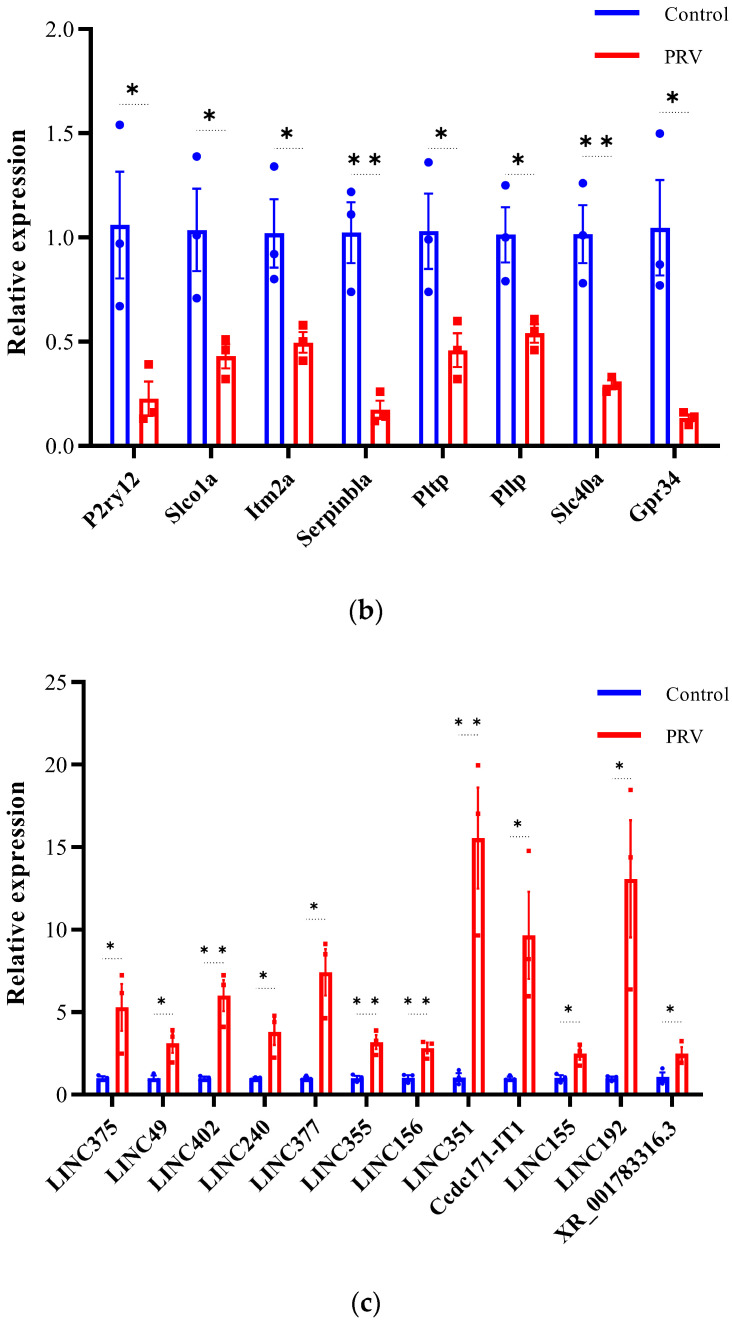
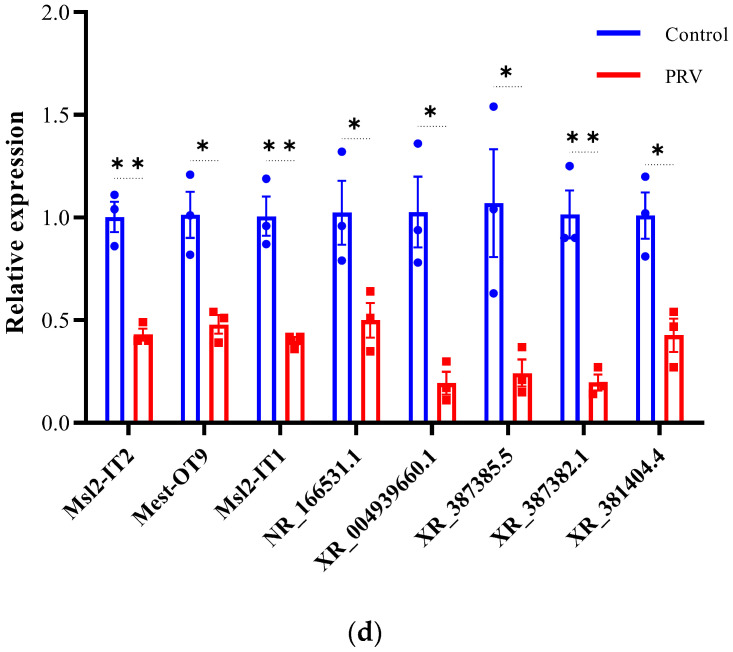
Pseudorabies virus (PRV) is a pathogen that causes severe neurological dysfunction in the host, leading to extensive neuronal damage and inflammation. Despite extensive research on the neuropathogenesis of α-herpesvirus infections, many scientific questions remain unresolved, such as the largely unknown functions of long non-coding RNAs (lncRNAs) in herpesvirus-infected nervous systems. To address these questions, we used RNA sequencing (RNA-seq) to investigate the expression profiles of lncRNAs and mRNAs in the brains of mice infected with PRV. Through bioinformatic analysis, we identified 316 differentially expressed lncRNAs and 886 differentially expressed mRNAs. We predicted the biological functions of these differentially expressed lncRNAs and mRNAs using the Gene Ontology (GO) and Kyoto Encyclopedia of Genes and Genomes (KEGG) databases, and the results showed that the differentially expressed transcripts were mainly involved in the innate immune response. Finally, we validated the differential expression trends of lncRNAs and mRNAs using quantitative real-time PCR (q-PCR), which were consistent with the sequencing data. To our knowledge, this is the first report analyzing the lncRNA expression profile in the central nervous system (CNS) of mice infected with PRV. Our findings provide new insights into the roles of lncRNAs and mRNAs during PRV infection of the host CNS.

Keywords: RNA-seq; brain; lncRNA; pseudorabies virus.


Conflict of interest statement

The authors declare no conflicts of interest.

Figures

Figure 1
Figure 1
Validation of PRV infection in mouse brains by qPCR. The copy number of the PRV EP0 gene in mouse brains at 48, 60, and 72 hpi was quantified by quantitative real-time PCR (q-PCR). Error bars represent the standard deviation between replicates. Data are presented as mean ± SD based on three independent experiments.
Figure 2
Figure 2
Volcano plot of differential transcripts between PRV infection group and mock-inoculated group. (a) Volcano plot of differentially expressed mRNAs between the PRV infection group and the mock-inoculated group. (b) Volcano plot of differentially expressed lncRNAs between the PRV infection group and the mock-inoculated group. In each plot, the x-axis represents log2(fold change), and the y-axis represents -log10(pvalue). Each dot represents a transcript, with red dots indicating upregulated transcripts and green dots indicating downregulated transcripts. The total number of upregulated and downregulated transcripts is labeled on the right side of each plot.
Figure 3
Figure 3
Hierarchical clustering analysis of differential transcript expression levels between PRV infection group and mock-inoculated group. (a) Heatmap of differentially expressed mRNA levels between the PRV infection group and the mock-inoculated group. (b) Heatmap of differentially expressed lncRNA levels between the PRV infection group and the mock-inoculated group. In each heatmap, the color intensity represents the levels of differential transcript expression, with color gradients from blue to red indicating downregulated to upregulated expression levels.
Figure 4
Figure 4
Bubble plots of GO enrichment analysis for differentially expressed transcripts between PRV infection group and mock-inoculated group. (a) Bubble plot of GO enrichment analysis for differentially expressed mRNAs, with padj < 0.05. (b) Bubble plot of GO enrichment analysis for target genes of differentially expressed lncRNAs predicted by co-expression, with pvalue < 0.05. (c) Bubble plot of GO enrichment analysis for target genes of differentially expressed lncRNAs predicted by co-location, with pvalue < 0.05. In the plots, the x-axis (GeneRatio) represents the ratio of the number of target genes enriched in a specific pathway to the total number of target genes. The y-axis indicates the biological processes or pathways where the functions are exerted. The size of the bubbles reflects the number of transcripts enriched in GO terms, and the color of the bubbles corresponds to different ranges of padj or pval.
Figure 5
Figure 5
KEGG enrichment analysis bubble plots of differentially expressed transcripts between PRV infection group and mock-inoculated group. (a) Bubble plot of KEGG enrichment analysis for differentially expressed mRNAs, with padj < 0.05. (b) Bubble plot of KEGG enrichment analysis for target genes of differentially expressed lncRNAs predicted by co-expression, with pvalue < 0.05. (c) Bubble plot of KEGG enrichment analysis for target genes of differentially expressed lncRNAs predicted by co-location, with pvalue < 0.05. In the plots, the x-axis (GeneRatio) represents the ratio of the number of target genes enriched in a specific pathway to the total number of target genes. The y-axis indicates the specific pathways that are enriched. The size of the bubbles reflects the number of transcripts enriched in KEGG pathways, and the color of the bubbles corresponds to different ranges of padj or pval.
Figure 6
Figure 6
Construction and module extraction of PPI network. (a) The overall PPI network generated from DEGs, comprises 403 nodes and 1993 edges, with an average node degree of 9.89, an average local clustering coefficient of 0.442, an expected number of edges of 557, and a PPI enrichment p-value < 1.0 × 10⁻¹⁶. (b) Module 1, composed of 28 nodes and 335 interaction pairs. (c) Module 2, composed of 19 nodes and 115 interaction pairs. (d) Module 3, composed of 22 nodes and 94 interaction pairs. (e) Module 4, composed of 23 nodes and 67 interaction pairs. The MCODE plugin in Cytoscape was used to extract densely connected modules from the PPI network, with the following parameters: degree cutoff = 2, node score cutoff = 0.2, K-score = 2, and maximum depth = 100. Each node represents DEGs, and each edge indicates the interaction between the proteins encoded by two genes.
Figure 7
Figure 7
Validation of differentially expressed mRNAs and lncRNAs by qRT-PCR (ad). Expression of mRNA transcripts and lncRNA transcripts was measured by qRT-PCR and data are represented as means ± S.D. and analyzed using unpaired two-tailed t-test. Statistical significance is indicated as follows: ****, p < 0.0001; **, p < 0.01; *, p < 0.05; and ns, no significance.
Figure 7
Figure 7
Validation of differentially expressed mRNAs and lncRNAs by qRT-PCR (ad). Expression of mRNA transcripts and lncRNA transcripts was measured by qRT-PCR and data are represented as means ± S.D. and analyzed using unpaired two-tailed t-test. Statistical significance is indicated as follows: ****, p < 0.0001; **, p < 0.01; *, p < 0.05; and ns, no significance.

Similar articles

References

    1. Zheng H.H., Fu P.F., Chen H.Y., Wang Z.Y. Pseudorabies Virus: From Pathogenesis to Prevention Strategies. Viruses. 2022;14:1638. doi: 10.3390/v14081638. - DOI - PMC - PubMed
    1. Papageorgiou K., Stoikou A., Papadopoulos D.K., Tsapouri-Kanoula E., Giantsis I.A., Papadopoulos D., Stamelou E., Sofia M., Billinis C., Karapetsiou C., et al. Pseudorabies Virus Prevalence in Lung Samples of Hunted Wild Boars in Northwestern Greece. Pathogens. 2024;13:929. doi: 10.3390/pathogens13110929. - DOI - PMC - PubMed
    1. Chen J., Li G., Wan C., Li Y., Peng L., Fang R., Peng Y., Ye C. A Comparison of Pseudorabies Virus Latency to Other alpha-Herpesvirinae Subfamily Members. Viruses. 2022;14:1386. doi: 10.3390/v14071386. - DOI - PMC - PubMed
    1. Klopfleisch R., Klupp B.G., Fuchs W., Kopp M., Teifke J.P., Mettenleiter T.C. Influence of pseudorabies virus proteins on neuroinvasion and neurovirulence in mice. J. Virol. 2006;80:5571–5576. doi: 10.1128/JVI.02589-05. - DOI - PMC - PubMed
    1. Pomeranz L.E., Reynolds A.E., Hengartner C.J. Molecular biology of pseudorabies virus: Impact on neurovirology and veterinary medicine. Microbiol. Mol. Biol. Rev. 2005;69:462–500. doi: 10.1128/MMBR.69.3.462-500.2005. - DOI - PMC - PubMed

Publication types

LinkOut - more resources