. 2025 Apr;31(4):e70410.
doi: 10.1111/cns.70410.

VDAC1 Inhibition Protects Against Noise-Induced Hearing Loss via the PINK1/Parkin Pathway

Affiliations

VDAC1 Inhibition Protects Against Noise-Induced Hearing Loss via the PINK1/Parkin Pathway

Yuchen Jin et al. CNS Neurosci Ther. 2025 Apr.

Abstract

Aims: This study examined the effect of 4,4'-diisothiocyanostilbene-2,2'-disulfonic acid (DIDS), an anion channel blocker of voltage-dependent anion channel 1 (VDAC1), on noise-induced hearing loss (NIHL) and its underlying mechanisms.

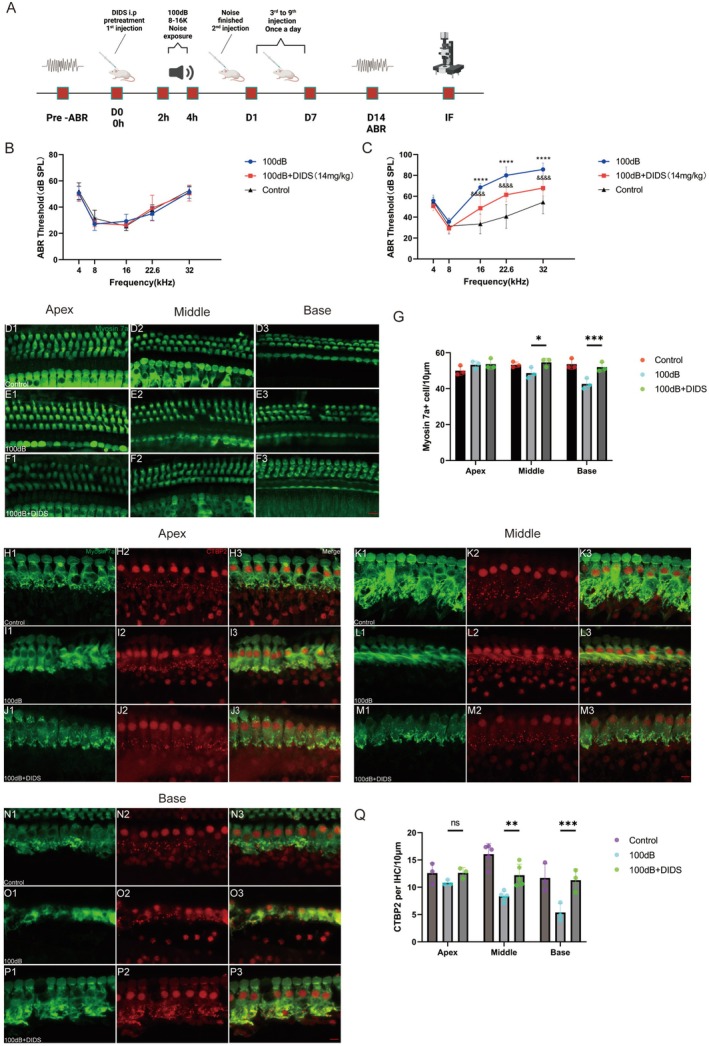
Methods: Cochlear explants and House Ear Institute-Organ of Corti 1 (HEI-OC1) cells were used to assess the effect of DIDS in vitro. Auditory brainstem responses were used to assess auditory functions in mice. Immunofluorescence staining of myosin 7a and CTBP2 were used to examine hair cells and synaptic ribbons. The accumulation of reactive oxygen species (ROS) was measured by 4-HNE staining. The gene expression changes of cochlea were analyzed using RNA sequencing.

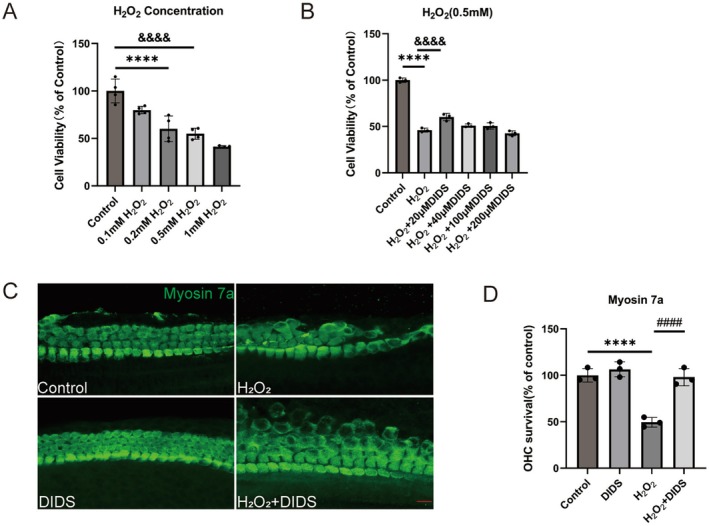
Results: DIDS reduced the levels of ROS in cochlear explants and attenuated cell death caused by hydrogen peroxide in both cochlear explants and HEI-OC1 cells. In C57BL/6 mice, DIDS reduced ROS generation and tumor necrosis factor-α induced by noise exposure, thereby protecting outer hair cells and inner hair cell synaptic ribbons from noise-induced damage through a mechanism involving the PINK1/Parkin signaling pathway. The preventive effect of DIDS in cochlear explants was eliminated by mitophagy inhibition.

Conclusion: VDAC1 inhibition enhances mitophagy in cochlear hair cells, playing a critical role in defending against oxidative stress and inflammation. Downregulation of VDAC1 may thus be considered a therapeutic strategy for preventing cochlear hair cell damage and reducing NIHL.

Keywords: 4,4′‐Diisothiocyanostilbene‐2,2′‐disulfonic acid; autophagy; hair cell; noise‐induced hearing loss; reactive oxygen species.


Conflict of interest statement

G.E.O. data set: Gene expression data (GSE137299 profiling data) were downloaded from Gene Expression Omnibus (https://www.ncbi.nlm.nih.gov/geo/).

Animal studies: All animal experiments were conducted in accordance with the guidelines of the Institutional Animal Care and Use Committee of the Shanghai Sixth People's Hospital, affiliated with Shanghai Jiao Tong University School of Medicine.

The authors declare no conflicts of interest.

Figures

FIGURE 1
FIGURE 1
Voltage‐dependent anion channel 1 (VDAC1) expression in cochlear hair cells (HCs). (A) The Unified Manifold Approximation and Projection plot depicting four distinct time points (E14, E16, P1, P7) in the development of the mouse cochlea. (B) A feature plot showing the expression of Ccer, Pcp4, Acbd7, Cib2, Pvalb (HC markers), and VDAC1. (C) Immunofluorescence staining of frozen sections of the mouse cochlea for DAPI (blue), phalloidin (green), and VDAC1 (red) reveals high levels of VDAC1 expression in HCs. Scale bar: 10 μm.
FIGURE 2
FIGURE 2
VDAC1 expression in the cochlea of C57BL/6 mice is increased by noise exposure. (A, B) Relative levels of VDAC1 determined by western blotting (n = 3). *p < 0.05 versus control group; *p < 0.05 versus 100 dB 7 day group. (C–E) Immunofluorescence staining for phalloidin (green) and VDAC1 (red) shows that the increase in VDAC1 expression after noise exposure is inhibited by DIDS (n = 3). Scale bar: 10 μm. (F) Quantitative analysis of VDAC1 expression in outer hair cells (OHCs, n = 3). ****p < 0.0001 versus control group; **p < 0.01 versus 100 dB group. (G, H) Relative levels of VDAC1 protein determined by western blotting (n = 3). **p < 0.05 versus 100 dB group.
FIGURE 3
FIGURE 3
DIDS protects HEI‐OC1 cells from H2O2 damage and prevents HC loss in H2O2‐exposed cochlear explants. (A) Survival rates of HEI‐OC1 cells exposed to varying concentrations of H2O2, as determined by a CCK‐8 assay (n = 4). ****p < 0.0001 and &&&& p < 0.0001 versus control group. (B) Viability of HEI‐OC1 cells exposed to 0.5 mmol/L H2O2 and varying concentrations of DIDS, as determined by a CCK‐8 assay (n = 3). ****p < 0.0001 versus control group; &&&& p < 0.0001 versus H2O2 group. (C) Representative images of the basal turn of cochlear explants in the various experimental groups after immunolabeling with myosin‐VIIa (green). Scale bar: 10 μm. (D) Quantitative analysis of OHC survival in the different groups (n = 3). ****p < 0.0001 versus control group; #### p < 0.0001 versus H2O2 group.
FIGURE 4
FIGURE 4
DIDS reduces noise‐induced ABR threshold shifts by protecting OHCs and IHC synaptic ribbons. (A) Experimental schedule. This figure was created with BioRender.com. (B) ABR thresholds of the different groups before treatment (n = 7). (C) Day 14 ABR thresholds in the different groups treated as described in (A) (n = 7). ****p < 0.0001 versus control group; &&&& p < 0.0001 versus 100 dB group. (D–F) Representative confocal images of myosin‐VIIa‐stained (green) cochlear HCs from the different groups. Scale bar: 10 μm. (G) Quantification of HCs per 100 μm in different areas of the cochlea based on myosin‐VIIa staining (n = 3). *p < 0.05 and ***p < 0.001 versus 100 dB group. (H–P) Representative images of immunolabeled CTBP2 in IHCs located in the three turns of the cochlea in noise‐exposed mice with or without DIDS supplementation and in the control group. Scale bar: 10 μm. (Q) Quantification of synaptic ribbons in IHCs in the middle turn (n = 5), apical turn (n = 3), basal turn (n = 3) of the cochlea with myosin‐VIIa (green) and CTBP2 (red). ****p < 0.001 and **p < 0.01 versus 100 dB group.
FIGURE 5
FIGURE 5
DIDS administration reduces oxidative stress in vitro and in vivo. (A–C) Representative images of the basal turn of cochlear explants immunolabeled with MitoSOX (red) and myosin‐VIIa (green). Scale bar: 10 μm. (D) MitoSOX immunolabeling shows significant variations across treatment groups (n = 3). ***p < 0.001 versus control group; &&& p < 0.001 versus H2O2 group. (E–G) Immunolabeled 4‐HNE (red) and myosin‐VIIa (green) in OHCs of the middle turn of the cochlea in noise‐exposed C57BL/6J mice with or without DIDS supplementation and in the control group. Scale bar: 10 μm. (H) Quantification of 4‐HNE staining (n = 3). **p < 0.01 versus control group; *p < 0.05 versus 100 dB group.
FIGURE 6
FIGURE 6
DIDS reduces TNF‐α expression in the organ of Corti (OC). (A) Volcano plot illustrating the results of RNA‐seq analysis, depicting the genes differentially expressed in the 100 dB + DIDS group versus the 100 dB group. (B) KEGG analysis shows the distribution of terms with statistically significant variances. (C) Representative immunohistochemical staining of TNF‐α in HCs. Scale bar: 5 μm. (D) Quantification of TNF‐α staining (n = 3). **p < 0.01 versus control group; *p < 0.05 versus 100 dB group.
FIGURE 7
FIGURE 7
Elevated levels of mitophagy in noise‐exposed mouse cochlea treated with DIDS. (A, B) Western blot of Parkin expression in the cochlea. Expression levels were normalized against β‐Actin (n = 3). *p < 0.05 versus 100 dB group. (C, D) Western blot of PINK1 expression in the cochlea (n = 3). Expression levels were normalized against β‐tubulin. *p < 0.05 versus 100 dB group. (E, F) Western blot of LC3‐II expression in the cochlea. Expression levels were normalized against β‐Actin (n = 4). *p < 0.05 versus 100 dB group; *p < 0.05 versus control group. (G, H) Western blot of p62 expression in the cochlea. Expression levels were normalized against β‐Actin (n = 4). *p < 0.05 versus 100 dB group.
FIGURE 8
FIGURE 8
Mitophagy inhibition using Mdivi‐1 exacerbates HC damage and oxidative stress. (A) Representative images of myosin‐VIIa‐immunolabeled (green) basal turn cochlear explants in the different experimental groups. Scale bar: 10 μm. (B) Quantitative analysis of OHC survival in the different groups (n = 3). **p < 0.01 versus H2O2 group; *p < 0.01 versus H2O2 + DIDS group. (C) Representative images of the basal turn of cochlear explants immunolabeled with MitoSOX (red) and myosin‐VIIa (green). Scale bar: 10 μm. (D) MitoSOX immunolabeling shows significant variations across different groups (n = 3). ****p < 0.0001 versus H2O2 group; **p < 0.01 versus H2O2 + DIDS group.

Similar articles

References

    1. Van De Water T. R., “Historical Aspects of Inner Ear Anatomy and Biology That Underlie the Design of Hearing and Balance Prosthetic Devices,” Anatomical Record 295, no. 11 (2012): 1741–1759, 10.1002/ar.22598. - DOI - PubMed
    1. Petrova N., Tebieva I., Kadyshev V., et al., “Hereditary Etiology of Non‐Syndromic Sensorineural Hearing Loss in the Republic of North Ossetia–Alania,” PeerJ 11 (2023): e14514, 10.7717/peerj.14514. - DOI - PMC - PubMed
    1. Xia A., Thai A., Cao Z., et al., “Chronic Suppurative Otitis Media Causes Macrophage‐Associated Sensorineural Hearing Loss,” Journal of Neuroinflammation 19, no. 1 (2022): 224, 10.1186/s12974-022-02585-w. - DOI - PMC - PubMed
    1. Tawfik K. O., Klepper K., Saliba J., and Friedman R. A., “Advances in Understanding of Presbycusis,” Journal of Neuroscience Research 98, no. 9 (2019): 1685–1697, 10.1002/jnr.24426. - DOI - PubMed
    1. Ma X., Chen L. N., Liao M., et al., “Molecular Insights Into the Activation Mechanism of GPR156 in Maintaining Auditory Function,” Nature Communications 15, no. 1 (2024): 10601, 10.1038/s41467-024-54681-5. - DOI - PMC - PubMed

MeSH terms

LinkOut - more resources