Observational Study
. 2025 Aug 1;31(8):2066-2080.
doi: 10.1093/ibd/izaf060.

Fecal Microbiome Reflects Disease State and Prognosis in Inflammatory Bowel Disease in an Adult Population-Based Inception Cohort

Affiliations
Observational Study

Fecal Microbiome Reflects Disease State and Prognosis in Inflammatory Bowel Disease in an Adult Population-Based Inception Cohort

Simen Hyll Hansen et al. Inflamm Bowel Dis. .

Abstract

Introduction: We aimed to determine the diagnostic and prognostic potential of baseline microbiome profiling in inflammatory bowel disease (IBD).

Methods: Participants with ulcerative colitis (UC), Crohn's disease (CD), suspected IBD, and non-IBD symptomatic controls were included in the prospective population-based cohort Inflammatory Bowel Disease in South-Eastern Norway III (third iteration) based on suspicion of IBD. The participants donated fecal samples that were analyzed with 16S rRNA sequencing. Disease course severity was evaluated at the 1-year follow-up. A stringent statistical consensus approach for differential abundance analysis with 3 different tools was applied, together with machine learning modeling.

Results: A total of 1404 individuals were included, where n = 1229 samples from adults were used in the main analyses (n = 658 UC, n = 324 CD, n = 36 IBD-U, n = 67 suspected IBD, and n = 144 non-IBD symptomatic controls). Microbiome profiles were compared with biochemical markers in machine learning models to differentiate IBD from non-IBD symptomatic controls (area under the receiver operating curve [AUC] 0.75-0.79). For UC vs controls, integrating microbiome data with biochemical markers like fecal calprotectin mildly improved classification (AUC 0.83 to 0.86, P < .0001). Extensive differences in microbiome composition between UC and CD were identified, which could be quantified as an index of differentially abundant genera. This index was validated across published datasets from 3 continents. The UC-CD index discriminated between ileal and colonic CD (linear regression, P = .008) and between colonic CD and UC (P = .005), suggesting a location-dependent gradient. Microbiome profiles outperformed biochemical markers in predicting a severe disease course in UC (AUC 0.72 vs 0.65, P < .0001), even in those with a mild disease at baseline (AUC 0.66 vs 0.59, P < .0001).

Conclusions: Fecal microbiome profiling at baseline held limited potential to diagnose IBD from non-IBD compared with standard-of-care. However, microbiome shows promise for predicting future disease courses in UC.

Keywords: Crohn’s disease; IBSEN; machine learning; ulcerative colitis.

Plain language summary

This study assessed the diagnostic and prognostic potential of baseline microbiome profiling in IBD. The microbiome holds the potential to differentiate IBD from controls and enhanced predictive capacity for UC severity. A UC-CD microbial index distinguished disease types and was validated with a global cohort.


Conflict of interest statement

M.G.M. holds shares in Bio-Me AS. S.O.F. reports personal fees during the last 2 years from Takeda, Galapagos, Jansen-Cilag, AbbVie, Pharmacosmos, Norgine, and Bristol-Myers-Squibb. The remaining authors disclose no conflicts.

Figures
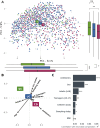
Figure 1.
Figure 1.
A, Beta diversity (Bray-Curtis dissimilarity) plot showing the microbial composition of all participants, colored by disease category (purple = Crohn’s disease [CD], blue = ulcerative colitis [UC], green = symptomatic controls [SC], and gray = miscellaneous categories [IBD-U, suspected IBD colon or suspected IBD small bowel]). The PC1 and PC2 axes denote the amount of variability explained by the principal coordinates. Box plots bordering the x- and y-axes show a significant difference in composition between CD and SC along both PC1 and PC2 (Mann-Whitney, P < .001 and P < .01, respectively), while there is no such difference between UC and SC (Mann-Whitney, P > .05). Adonis/PERMANOVA indicates that there are still compositional differences between these groups (P < .0001 for all mentioned comparisons). B, Loading plot showing the relationship between bacterial composition (from plot A) and diagnostic groups, age groups, BMI, sex, sampling delay (time from diagnosis to delivered fecal sample), and antibiotics use (within 3 months prior to inclusion). C, Barplot demonstrating statistics from the loading plot. Shows that antibiotics use, sex, and age (in the form of adults vs children under 18 years of age) are highly correlated with bacterial composition as visualized in plots A and B (P ≤ .001, R² > 0.01). To a lesser extent, sampling delay shows some association (P < .05, R² = 0.007), while BMI is not associated with bacterial composition (P = .8, R² = 0.0007).
Figure 2.
Figure 2.
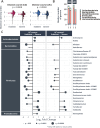
A, Alpha diversity plots showing that CD and UC have a reduced diversity as estimated by the Shannon diversity index, compared to symptomatic and healthy controls (SC and HC, respectively). Barplot demonstrates effect size and P-value of alpha diversity differences after correcting for age, sex, BMI, and antibiotics in a generalized linear model (GLM). Only samples sequenced together are used for this analysis (see Methods). B, Plot visualizing taxa that are differential abundant between the 2 groups by q < 0.05. The dot size represents the q value, X-axis demonstrates log(e) fold changes estimated by ANCOM-BC2, but all 3 methods showed similar fold change patterns. Most taxa differing between the diagnostic groups belong to the phylum Firmicutes, many of which are significantly decreased in IBD compared to symptomatic controls. Twenty-seven taxa were differentially abundant between UC and CD. CD, Crohn’s disease; IBD, inflammatory bowel disease; UC, ulcerative colitis.
Figure 3.
Figure 3.
A, The UC-CD-index score differs depending on the site of inflammation, defined by CD Montreal localization. Horizontal black lines with dots represent the median and IQR. B, Differences between UC and CD in a validation cohort consisting of 36 public datasets. In all 3 examined continents, persons with UC had significantly higher values than CD in the UC-CD index defined in our study. CD, Crohn’s disease; IQR, interquartile range; UC, ulcerative colitis.
Figure 4.
Figure 4.
A, Alpha diversity plots demonstrating a reduced diversity as measured by the Shannon diversity index in those patients with a future severe disease course in CD and UC, respectively. B, Bar plot showing average numbers of different genera, demonstrating that the major factor affecting the loss of diversity is the phylum Firmicutes (which contains the class Clostridia). (C) Differential abundance plot showcasing the results from the 3 DA methods (ANCOM-BC2, LinDA, and MaAsLin2). Only taxa with FDR-adjusted P-values (q) less than .05 in all 3 methods are included. The dot size represents the q value, X-axis demonstrates log(e) fold changes estimated by ANCOM-BC2, but all 3 methods showed similar fold change patterns. Most taxa differing between the diagnostic groups belong to the class Clostridia, many of which are significantly decreased in UC patients with a future severe disease course compared to those with an indolent disease course. Twenty-six taxa were differentially abundant between patients with severe and indolent disease courses. CD, Crohn’s disease; UC, ulcerative colitis.
Figure 5.
Figure 5.
A, B, C, D, AUC curves showing the predictive capacity of 3 different sets of variables for classifying a future severe disease course in CD and UC, respectively. In CD, the variable set “Clinical” scored significantly better than microbiome data (P < .0001). The opposite was true in UC, where the microbiome held the best predictive capacity of the 2 (P < .0001). When excluding patients admitted with a severe baseline Mayo endoscopic subscore with left-sided to total colitis, the microbiome was still the best performer, but no longer significantly better than “Clinical.” *Excluding severe baseline Mayo score with left-sided to total colitis; **Only left-sided or total colitis. AUC, area under the receiver operating curve; CD, Crohn’s disease; UC, ulcerative colitis.

References

    1. Clooney AG, Eckenberger J, Laserna-Mendieta E, et al. Ranking microbiome variance in inflammatory bowel disease: a large longitudinal intercontinental study. Gut. 2020;70(3):499-510. doi: 10.1136/gutjnl-2020-321106 - DOI - PMC - PubMed
    1. Garrett WS, Lord GM, Punit S, et al. Communicable ulcerative colitis induced by T-bet deficiency in the innate immune system. Cell. 2007;131(1):33-45. doi: 10.1016/j.cell.2007.08.017 - DOI - PMC - PubMed
    1. Gevers D, Kugathasan S, Denson LA, et al. The treatment-naive microbiome in new-onset Crohn’s disease. Cell Host Microbe 2014;15(3):382-392. doi: 10.1016/j.chom.2014.02.005 - DOI - PMC - PubMed
    1. Moayyedi P, Surette MG, Kim PT, et al. Fecal microbiota transplantation induces remission in patients with active ulcerative colitis in a randomized controlled trial. Gastroenterology. 2015;149(1):102-109.e6. doi: 10.1053/j.gastro.2015.04.001 - DOI - PubMed
    1. Ng SC, Shi HY, Hamidi N, et al. Worldwide incidence and prevalence of inflammatory bowel disease in the 21st century: a systematic review of population-based studies. Lancet. 2017;390(10114):2769-2778. doi: 10.1016/S0140-6736(17)32448-0 - DOI - PubMed

Publication types

MeSH terms