. 2025 Aug 15;157(4):773-787.
doi: 10.1002/ijc.35458. Epub 2025 Apr 26.

A heterodimer of hemoglobin identifies theranostic targets on brain-metastasizing melanoma cells

Affiliations

A heterodimer of hemoglobin identifies theranostic targets on brain-metastasizing melanoma cells

Maharrish Chelladurai et al. Int J Cancer. .

Abstract

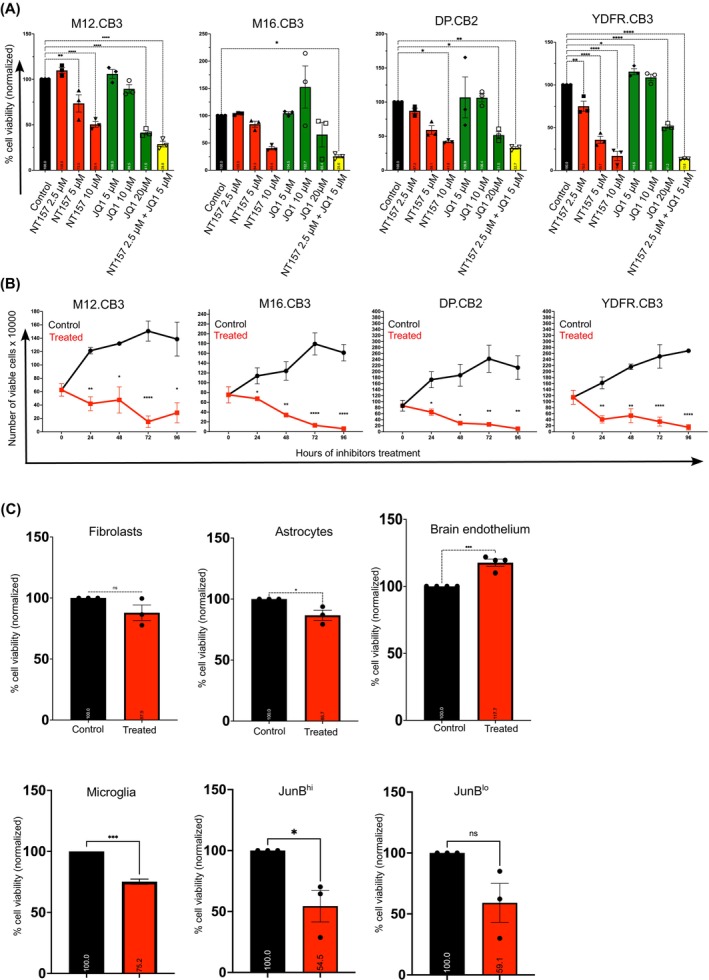
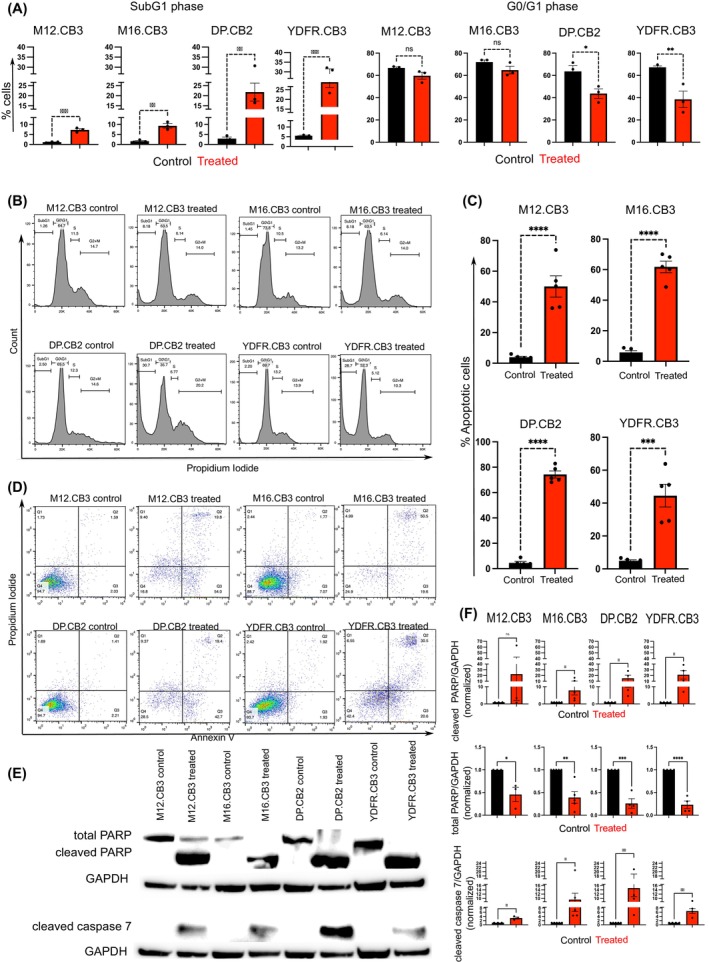
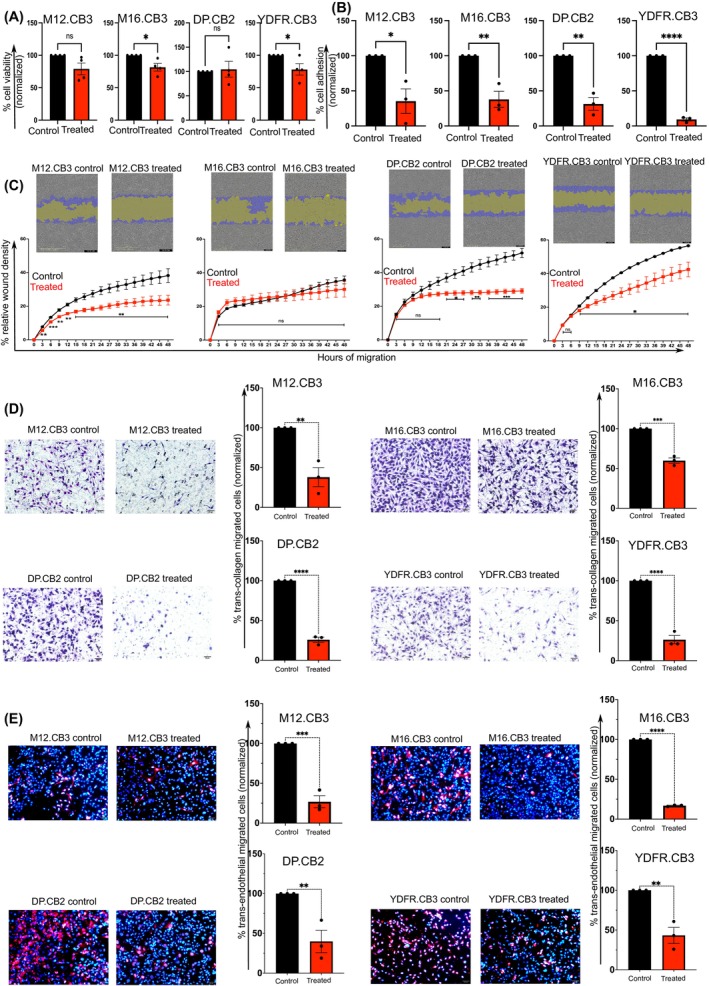
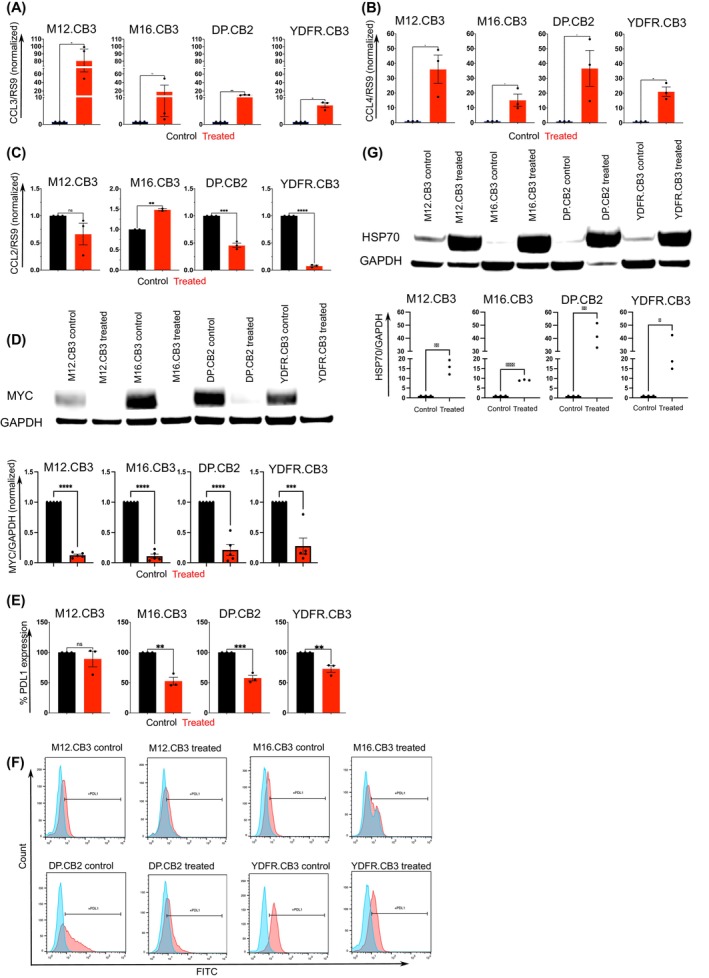
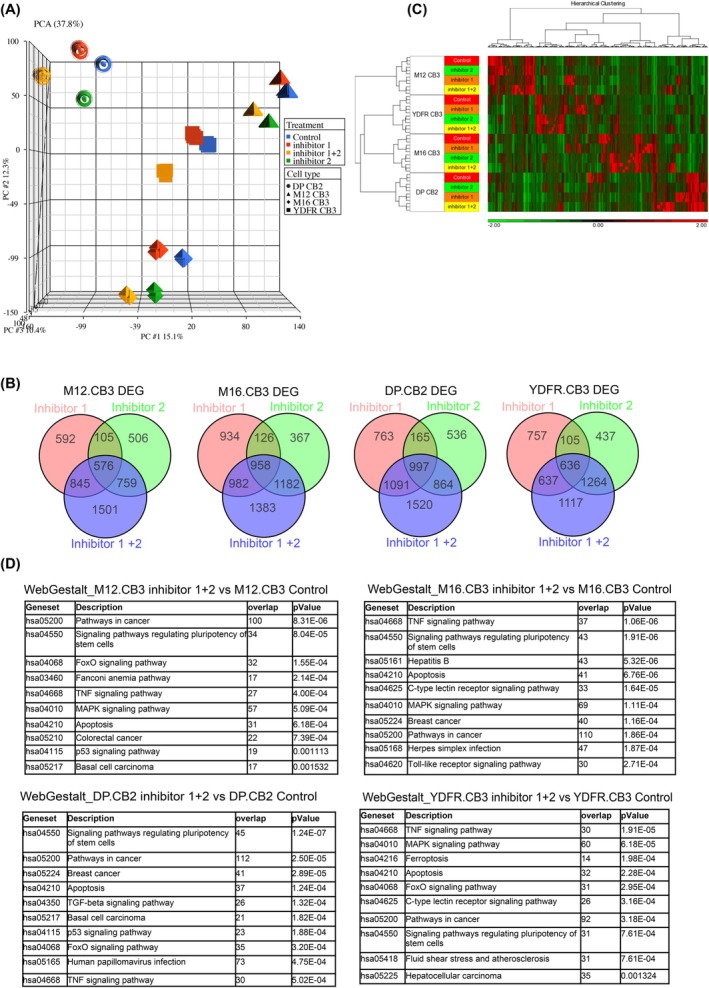
Cancer microenvironments encompass both cancer-promoting and cancer-restraining factors. If these factors cancel each other, cancer dormancy may ensue. In search of microenvironmental factors that keep dormant lung-metastasizing neuroblastoma cells and brain-metastasizing melanoma cells (BMMC) in check, we identified the beta subunit of hemoglobin and a heterodimer of alpha and beta chains of hemoglobin (α/β dimer) in the lung and brain microenvironments, respectively, as anti-metastatic factors. A previous study demonstrated that the α/β dimer triggers programmed cell death of BMMC and downregulates the expression of BRD4, GAB2, and IRS2 proteins, which perform essential functions in tumorigenesis and progression. The working hypothesis of the present study is that in addition to its tumoricidal function, the α/β dimer serves as a pathfinder for the identification of therapy targets for BMMC. We, therefore, employed small-molecule inhibitors of Bromodomain-containing protein 4 (BRD4), GRB2-associated-binding protein 2 (GAB2), and Insulin receptor substrate 2 (IRS2) as potential anti-BMMC agents. A combination of sub-lethal concentrations of BRD4 and IRS2 inhibitors synergistically arrested BMMC at the subG1 phase of the cell cycle and killed more than 70% of BMMCs. The BRD4/IRS2 inhibitor cocktail (designated hereafter as BRIRi) moderated the malignancy of BMMC lines from four different human melanomas. Preliminary results suggest that the BRIRi modulated "cold" BMMC to "hot" ones. Among the top enriched functions of differentially expressed genes identified by RNAseq of BRIRi-treated versus control BMMC, TNF and apoptotic signaling pathways were observed. We propose that co-targeting BRD4 and IRS2 offers a promising approach for treating BMMC.

Keywords: JQ1 (BRD4 inhibitor); NT157 (IRS2 inhibitor); melanoma; melanoma brain metastasis; tumor microenvironment.


Conflict of interest statement

The authors have declared that no competing interests exist.

Figures

FIGURE 1
FIGURE 1
BRD4 and IRS2 inhibitors target both melanoma and melanoma‐promoting non‐cancerous microenvironmental cells. (A) Cytotoxicity of NT157 (IRS2 inhibitor) and JQ1 (BRD4 inhibitor) on four BMMC was evaluated using XTT assay after treating cells for 24 h. Starvation medium (0.5% FCS) with 0.001% DMSO served as a control. Results are shown as mean ± SEM of three independent experiments. Significance was evaluated using one‐way ANOVA. *p < 0.05, **p < 0.01, ****p < 0.001. (B) The growth curve of the four BMMCs was obtained by treating them once with BRIRi and quantifying viable cells manually using trypan blue every 24 h up to 96 h. Results are shown as mean ± SEM of three independent experiments. Significance was evaluated using the Student's t test. *p < 0.05, **p < 0.01, ****p < 0.001. (C) Cytotoxicity of BRIRi on non‐cancerous cell lines such as fibroblasts, astrocytes, brain endothelial cell line, microglia, microglia‐JunBhi, and microglia‐JunBlo was evaluated after treatment with BRIRi for 24 h. Results are shown as mean ± SEM of three independent experiments. Significance was evaluated using the Student's t test. *p < 0.05, ***p < 0.005.
FIGURE 2
FIGURE 2
BRD4 and IRS2 inhibitors induce cell cycle arrest and cell death. (A) Cell cycle analysis was performed using flow cytometry to determine the percentage of cells in different phases following treatment with BRIRi. The percentages of cells in the SubG1 and G 0/G 1 phases of the cell cycle were calculated and represented as mean ± SEM of three independent experiments. Significance was evaluated using the Student's t test. *p < 0.05, **p < 0.01, ***p < 0.005. (B) Representative images of cell cycle arrest from one of three independent experiments are shown. (C, D) The mode of cell death induced by the BRIRi was evaluated using Annexin V—PI staining. Starvation medium (0.5% FCS) with 0.001% DMSO was used as a control. (C) The percentage of cells that underwent apoptosis was calculated and represented as mean ± SEM of five independent experiments. Significance was calculated using the Student's t test. ***p < 0.005, ****p < 0.001. (D) Representative images of cell death in one of five independent experiments are shown. Q1: Necrosis, Q2: Late apoptosis, Q3: Early apoptosis, and Q4: Live cells. (E) Western blot analysis for the expression of total PARP, cleaved PARP, and cleaved caspase 7. GAPDH was used as a loading control. Representative blots of one of at least three independent experiments are shown. (F) The expression of total PARP, cleaved PARP, and cleaved caspase 7 was quantified using ImageJ. Results are shown as mean ± SEM of at least three independent experiments. Significance was evaluated using the Student's t test. *p < 0.05, **p < 0.01, ***p < 0.005, ****p < 0.001.
FIGURE 3
FIGURE 3
BRD4 and IRS2 inhibitors abrogate BMMC malignancy phenotype. (A) BMMC lines were pretreated with BRIRi for 3 h, starved for 24 h, and then cell viability was measured using the XTT assay. Results are shown as mean ± SEM of four independent experiments. (B) The percentage of melanoma cells treated with BRIRi that adhered to the brain endothelium was calculated and shown as mean ± SEM of three independent experiments. (C) The rate of migration of BRIRi‐treated cells in a wound healing assay was calculated using the Incucyte assay and shown as mean ± SEM of three independent experiments. Representative images of wound closure from one of three independent experiments are shown. (D) The percentage of BRIRi‐treated cells that transmigrated the collagen layer was calculated and shown as mean ± SEM of three independent experiments. Representative images of trans‐collagen migrating cells are shown. (E) The percentage of BRIRi‐treated cells that transmigrated the brain endothelium was calculated and shown as mean ± SEM of three independent experiments. Representative images of trans‐endothelial migrating cells are shown. (A‐E) In all the above experiments, a starvation medium (0.5% FCS) with 0.001% DMSO served as a control. Significance was evaluated using the Student's t test. *p < 0.05, **p < 0.01, ***p < 0.005, ****p < 0.001.
FIGURE 4
FIGURE 4
BRD4 and IRS2 inhibitors transform the immunosuppressive phenotype of melanoma. (A–C) mRNA expression of CCL3 (A), CCL4 (B), and CCL2 (C) was quantified in BMMC treated with BRIRi for 3 h. Data are shown as mean ± SEM of three independent experiments. Significance was evaluated using the Student's t test. *p < 0.05, **p < 0.01, ***p < 0.005, ****p < 0.001. (D) Western blot analysis of the expression of MYC in cells treated with BRIRi for 24 h. GAPDH was used as a loading control. MYC expression was quantified using ImageJ. Data are shown as mean ± SEM of one of five independent experiments. Representative blots of one of at least five independent experiments are shown. (E–F) The expression of the cell surface marker PD‐L1 was measured by flow cytometry in BMMC, which was pretreated with BRIRi and starved for 24 h. (E) Data are shown as mean ± SEM of one of three independent experiments. (F) Representative histograms from one of three independent experiments are shown. (G) Western blot analysis of the expression of HSP70 in cells treated with BRIRi for 24 h. GAPDH was used as a loading control. Data are shown as mean ± SEM of one of three independent experiments. Representative blots of one of at least three independent experiments are shown. (A–G) Significance was evaluated using the Student's t test. *p < 0.05, **p < 0.01, ***p < 0.005, ****p < 0.001.
FIGURE 5
FIGURE 5
BRD4 and IRS2 inhibitors alter the transcriptomic landscape of BMMC. (A) Principal component analysis (PCA) of bulk RNA‐seq data (DMSO‐treated cells, BRD4 inhibitor‐treated cells, IRS2 inhibitor‐treated cells, and BRIRi‐treated cells) of four BMMC lines shows a distinct difference between DMSO‐treated cells and BRIRi‐treated cells. (B) Venn diagrams depict the total number of genes that are differentially expressed post different inhibitor treatments in four BMMCs. (C) Clustered analysis of DMSO‐treated cells, BRD4i‐treated cells, IRS2 inhibitor‐treated cells, and BRIRi‐treated cells from the RNA‐seq data. (D) Tables of the top 10 enriched functions of differentially expressed genes derived from the RNA‐seq data using DAVID. (A–D) inhibitor 1 refers to NT157 (IRS2 inhibitor), inhibitor 2 refers to JQ1 (BRD4i).

Similar articles

References

    1. Cozar B, Greppi M, Carpentier S, Narni‐Mancinelli E, Chiossone L, Vivier E. Tumor‐infiltrating natural killer cells. Cancer Discov. 2021;11:34‐44. - PMC - PubMed
    1. Pardoll D. Does the immune system see tumors as foreign or self? Annu Rev Immunol. 2003;21:807‐839. - PubMed
    1. Zhan HX, Zhou B, Cheng YG, et al. Crosstalk between stromal cells and cancer cells in pancreatic cancer: new insights into stromal biology. Cancer Lett. 2017;392:83‐93. - PubMed
    1. Rubin H. Microenvironmental regulation of the initiated cell. Adv Cancer Res. 2003;90:1‐62. - PubMed
    1. Delinassios JG. Cytocidal effects of human fibroblasts on HeLa cells in vitro. Biol Cell. 1987;59:69‐77. - PubMed

MeSH terms