. 2025 Jun;12(23):e2417715.
doi: 10.1002/advs.202417715. Epub 2025 Apr 26.

LncRNA-MEG3 Regulates Muscle Mass and Metabolic Homeostasis by Facilitating SUZ12 Liquid-Liquid Phase Separation

Affiliations

LncRNA-MEG3 Regulates Muscle Mass and Metabolic Homeostasis by Facilitating SUZ12 Liquid-Liquid Phase Separation

Yilong Yao et al. Adv Sci (Weinh). 2025 Jun.

Abstract

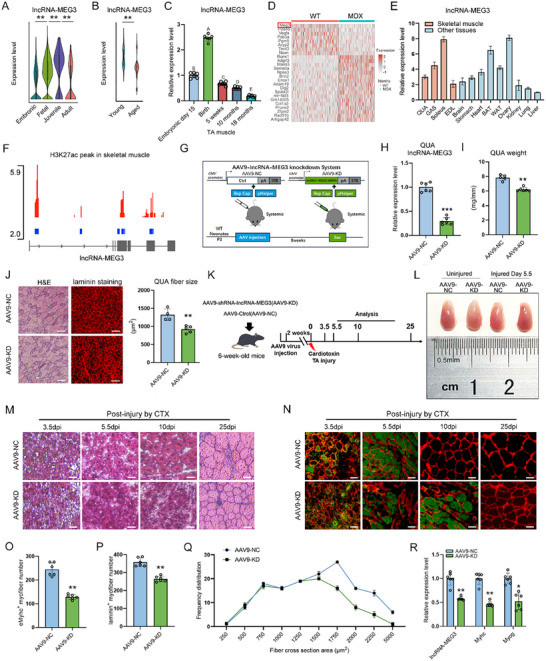
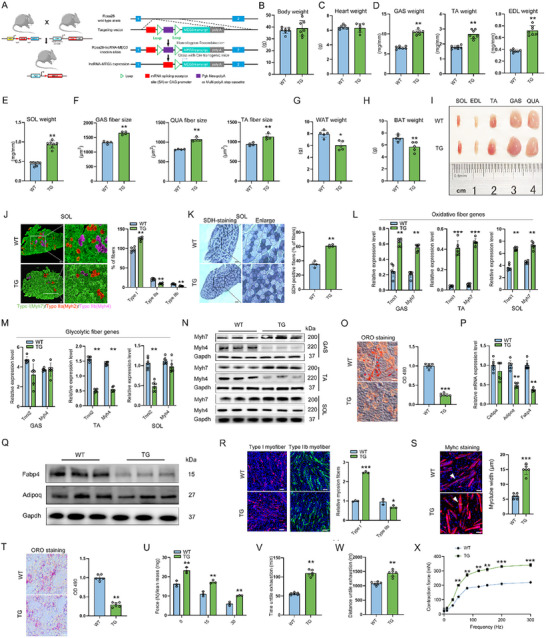
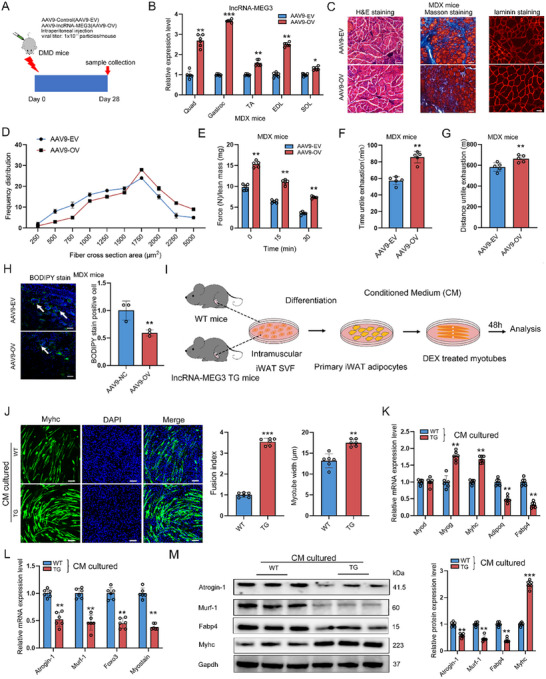
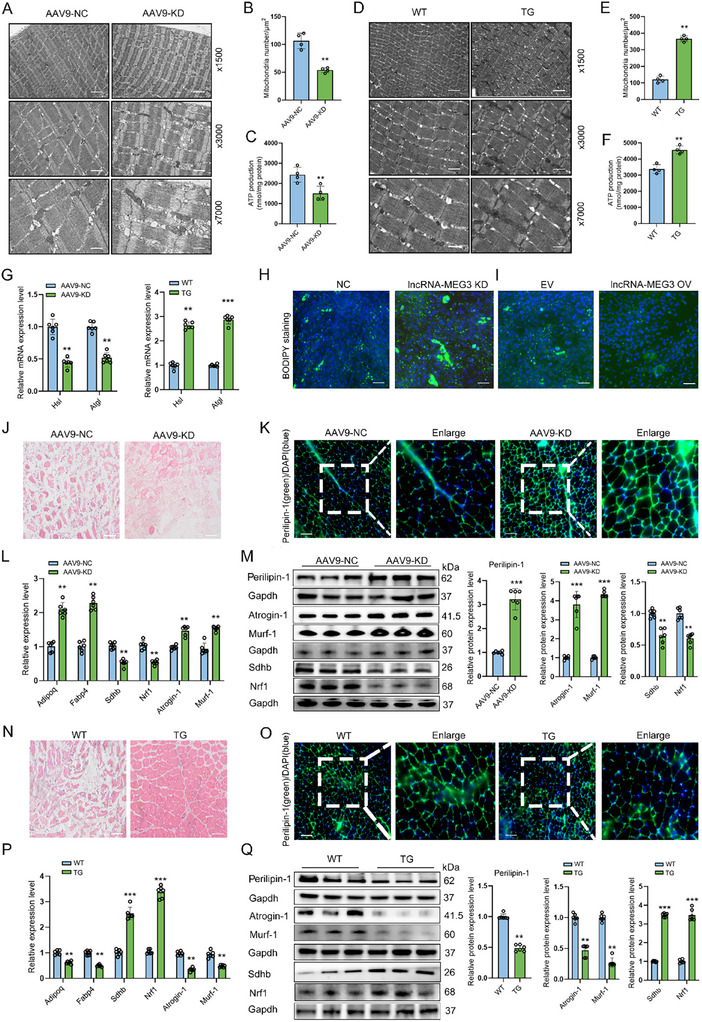
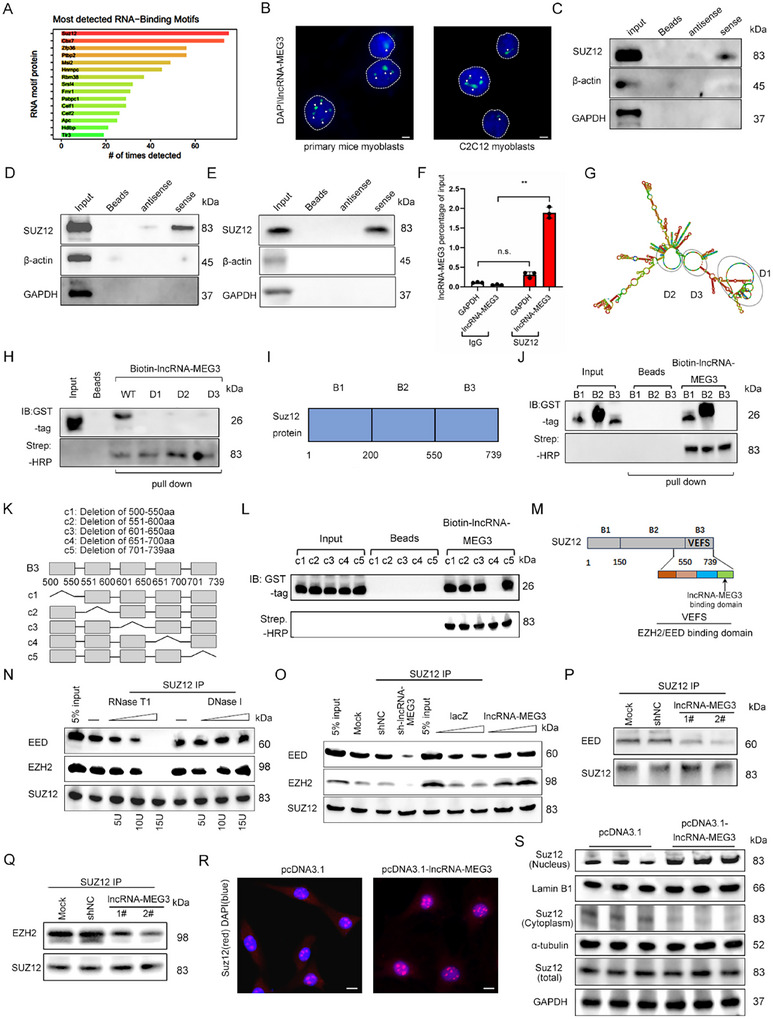
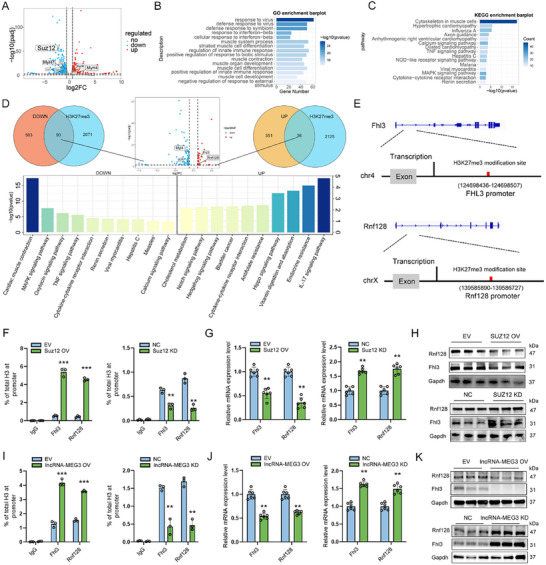
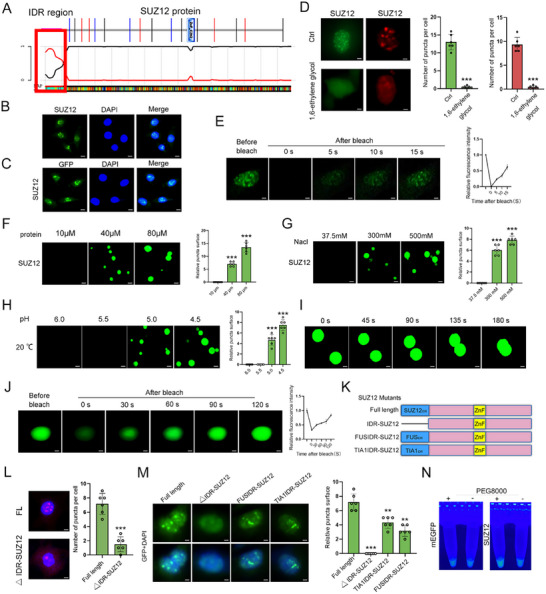
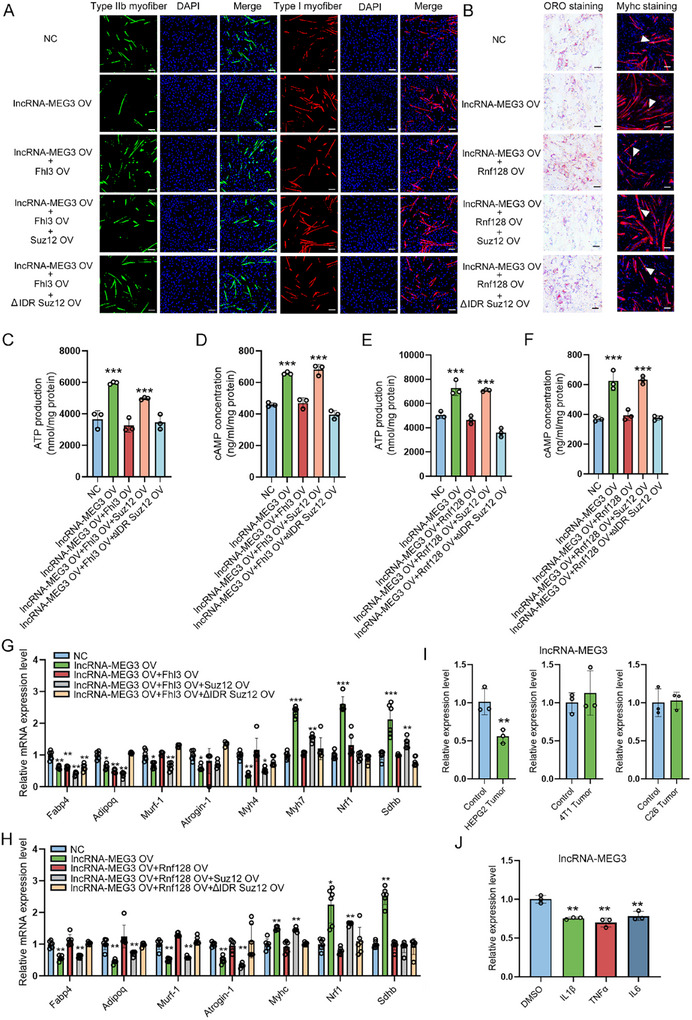
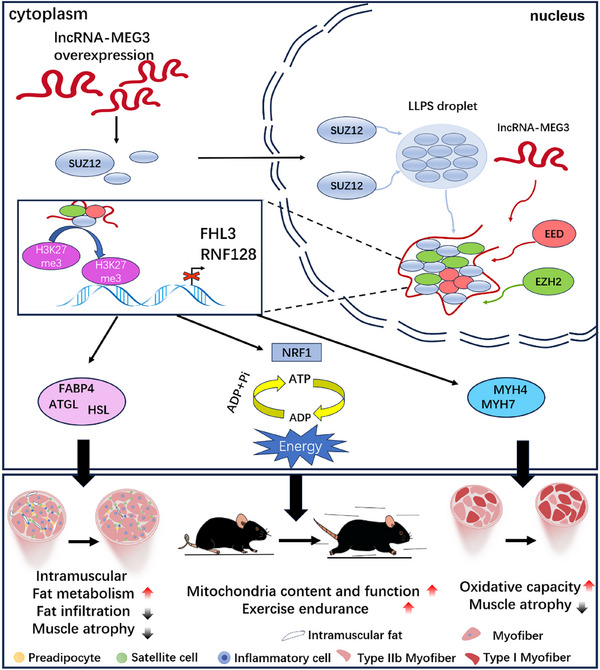
Skeletal muscle plays a crucial role in maintaining motor function and metabolic homeostasis, with its loss or atrophy leading to significant health consequences. Long non-coding RNAs (lncRNAs) have emerged as key regulators in muscle biology; however, their precise roles in muscle function and pathology remain to be fully elucidated. This study demonstrates that lncRNA maternally expressed gene 3 (MEG3) is preferentially expressed in slow-twitch muscle fibers and dynamically regulated during muscle development, aging, and in the context of Duchenne muscular dystrophy (DMD). Using both loss- and gain-of-function mice models, this study shows that lncRNA-MEG3 is critical for preserving muscle mass and function. Its depletion leads to muscle atrophy, mitochondrial dysfunction, and impaired regenerative capacity, while overexpression enhances muscle mass, increases oxidative muscle fiber content, and improves endurance. Notably, lncRNA-MEG3 overexpression in MDX mice significantly alleviates muscle wasting and adipose tissue infiltration. Mechanistically, this study uncovers a novel interaction between lncRNA-MEG3 and the polycomb repressive complex 2 (PRC2), where lncRNA-MEG3 binds to SUZ12 polycomb repressive complex 2 subunit (Suz12), stabilizes PRC2, facilitates SUZ12 liquid-liquid phase separation (LLPS), and regulates the epigenetic modulation of four and a half lim domains 3 (Fhl3) and ring finger protein 128 (Rnf128). These findings not only highlight the crucial role of lncRNA-MEG3 in muscle homeostasis but also provide new insights into lncRNA-based therapeutic strategies for muscle-related diseases.

Keywords: SUZ12 LLPS; fat infiltration; lncRNA‐MEG3; muscle atrophy; oxidative muscle fibers.


Conflict of interest statement

The authors declare no conflict of interest.

Figures

Figure 1
Figure 1
LncRNA‐MEG3 controls the development of skeletal muscle mass and regeneration. A) Violin plots depicting the expression levels of lncRNA‐MEG3 across the MuSCs cluster in human skeletal muscle at different developmental stages (embryonic, fetal, juvenile, and adult) (n = 3). B) Violin plots showing the expression levels of lncRNA‐MEG3 in the differentiation cluster of MuSCs from young and aged mice (n = 3). C) qRT‐PCR analysis of lncRNA‐MEG3 expression at different skeletal muscle developmental stages in mice (n = 6). (A, B, C, D, and E indicate a highly significant difference). D) Heat map illustrating differentially expressed genes in skeletal muscle tissue from wild‐type (WT) and MDX mice. E) qRT‐PCR showing lncRNA‐MEG3 expression across various tissues (Quadriceps femoris (QUA), Gastrocnemius (GAS), Soleus (SOL), Extensor digitorum longus (EDL), Brain, Stomach, Heart, Brown adipose tissue (BAT), White adipose tissue (WAT), Ovary, Kidney, Lung and Liver) from 6‐week‐old mice (n = 3). F) GTEx database analysis shows H3K27ac marks in muscle tissue along the lncRNA‐MEG3 locus, indicating the presence of an enhancer. G) Schematic representation of knockdown strategy using AAV9‐NC or AAV9‐lncRNA‐MEG3 shRNA (AAV9‐KD) injections into neonatal WT mice. Experimental timeline created in Adobe Illustrator. H) qRT‐PCR analysis of lncRNA‐MEG3 expression in muscle tissue from AAV9‐NC or AAV9‐KD injected mice (n = 6). I) QUA muscle weight in 8 weeks post‐AAV9‐NC (n = 5) or AAV9‐KD (n = 6) injections mice. J) QUA myofiber size in 8 weeks post‐AAV9‐NC (n = 4) or AAV9‐KD (n = 5) injections mice. Scale bar = 100 µm. K) Schematic representation of the experimental design for AAV9 injections and analysis timeline. Adult mice received AAV9 knockdown lncRNA‐MEG3 (AAV9‐KD) or a control vector (AAV9‐NC) followed by cardiotoxin (CTX)‐induced injury on mice TA muscle. Analysis was performed at various time points post‐injury (3.5, 5.5, 10‐, and 25‐days post‐injury (dpi)). L) Representative images of injured and uninjured TA muscles from AAV9‐NC and AAV9‐KD mice (n = 6). Scale bar = 0.5 cm. Representative H&E staining M) and immunofluorescence (IF) staining N) of TA muscle cross‐sections (n = 3). Scale bar = 50 µm. O) Quantification of eMyHC+ myofibers in TA muscle cross‐sections at 5.5 dpi (n = 6). P) Quantification of laminin+ myofibers in TA muscle cross‐sections at 10 dpi (n = 6). Q) Distribution of fiber sizes at 10 dpi from AAV9‐NC and AAV9‐KD mice TA muscle after CTX injury (n = 4). R) qRT‐PCR showing the lncRNA‐MEG3, Myhc and Myog expression at 10 dpi after knockdown lncRNA‐MEG3 in TA muscle (n = 6). Data are mean ± SD; p‐values were calculated using Student's t‐test. * p < 0.05, ** p < 0.01 and *** p < 0.001.
Figure 2
Figure 2
LncRNA‐MEG3 TG mice maintain muscle mass and promote an increase in slow‐twitch muscle fibers. A) Schematic illustrating the experimental design for TG mice with lncRNA‐MEG3 overexpression, generated through Cre‐LoxP‐mediated homologous recombination at the Rosa26 locus to induce lncRNA‐MEG3 expression. B) Body weight, C) Heart weight, D) GAS weight, TA weight, EDL weight, and E) SOL weight in wild‐type (WT) and lncRNA‐MEG3 TG mice (n = 7). All weights were normalized to tibia length (TL) to account for differences in body size WT and TG. F) Fiber size of GAS, TA, and QUA muscles in WT and lncRNA‐MEG3 TG mice (n = 4). G,H) WAT (G) and BAT weight (H) in WT and lncRNA‐MEG3 TG mice (n = 5). I) Representative images of skeletal muscle (SOL, GAS, EDL, QUA, and TA) from 6‐month‐old WT and TG mice (n = 3). Scale bar = 0.5 cm. J) Representative Myh7, Myh4, and Myh2 immunostaining in SOL muscles from WT and lncRNA‐MEG3 TG mice, with quantification of staining intensity using ImageJ (n = 3). Quantification is shown (right panel). Scale bar = 200 µm. K) Representative SDH staining of SOL muscle sections from WT and lncRNA‐MEG3 TG mice, with quantification of SDH‐positive fibers using ImageJ (n = 4). Scale bar = 200 µm. L–N) qRT‐PCR (n = 6) and Western blot (n = 3) analyses showing the expression of oxidative and glycolytic genes relative to marker genes in GAS, TA, and SOL muscles from WT and lncRNA‐MEG3 TG mice. O) Representative Oil Red O (ORO) staining of lipid droplets in GAS muscle tissue from WT and lncRNA‐MEG3 TG mice (n = 6). Scale bar = 50 µm. P,Q) qRT‐PCR (n = 6) and Western blot (n = 3) analysis of adipogenesis‐related gene expression in GAS muscle tissue from WT and lncRNA‐MEG3 TG mice. R) Representative Myh7 and Myh4 immunostaining in primary myotubes derived from WT and lncRNA‐MEG3 TG mice (n = 3). Scale bar = 100 µm. S) Representative Myhc staining and quantification of myotube width in primary myotubes from WT and lncRNA‐MEG3 TG mice (n = 6). Scale bar = 50 µm. T) Representative ORO staining of lipid droplets in primary myotubes from WT and lncRNA‐MEG3 TG mice (n = 6). Scale bar = 50 µm. U–W) Forelimb grip strength measurements (n = 3) (U) and treadmill endurance performance, including running time (V) and distance (W) in WT and lncRNA‐MEG3 TG mice (n = 6). Forelimb grip strength was measured at 15 min intervals and standardized to lean body weight. (X) The contraction force was determined by triggering contraction using incremental stimulation frequencies (1 ms pulses at 0–300 Hz for 500 ms at 100 V) (n = 3). Data are mean ± SD; p‐values were calculated using Student's t‐test. * p < 0.05, ** p < 0.01 and *** p < 0.001.
Figure 3
Figure 3
LncRNA‐MEG3 regulates muscle atrophy induced by fat infiltration. A) Schematic of the experimental design using AAV9‐based overexpression (AAV9‐OV) in MDX mice. B) Expression of lncRNA‐MEG3 in QUA, GAS, TA, EDL, and SOL muscles after AAV9‐OV injection in MDX mice (n = 6). C) Representative H&E, Masson, and Laminin staining of muscle cross‐sections showing structural changes following AAV9‐OV in MDX mice (n = 6). scale bar = 50 µm. D) Distribution of myofiber sizes in AAV9‐EV and AAV9‐OV MDX mice (n = 6). E–G) Forelimb grip strength treadmill endurance performance in MDX mice treated with AAV9‐EV or AAV9‐OV (n = 5). (H) Representative BODIPY staining of lipid droplets in muscle tissues and quantification of lipid number (n = 3). scale bar = 50 µm. I) Schematic illustration of the co‐culture system of beige adipocytes and myotubes. J) Representative images of Myhc staining and myotube width in DEX‐treated C2C12 myotubes cultured with or without a conditioned medium (CM) from differentiated primary beige adipocytes of WT and lncRNA‐MEG3 TG mice (n = 6). Scale bar = 100 µm. K–M) qRT‐PCR and Western blot showing the expression of adipogenesis, muscle atrophy, and differentiation marker genes in DEX‐treated C2C12 myotubes cultured with or without CM from differentiated primary beige adipocytes of WT and lncRNA‐MEG3 TG mice (n = 6). CM: Conditioned medium, DEX: Dexamethasone. Data are mean ± SD; p‐values were calculated using Student's t‐test. * p < 0.05, ** p < 0.01 and *** p < 0.001.
Figure 4
Figure 4
LncRNA‐MEG3 regulates mitochondrial biogenesis impairment induced by fat infiltration. A) Representative transmission electron microscopy (TEM) images of mitochondrial ultrastructure in skeletal muscles from AAV9‐NC and AAV9‐KD mice (n = 4). B) Quantification of mitochondrial density per µm2 in skeletal muscles in AAV9‐NC and AAV9‐KD mice (n = 4). C) ATP production levels in AAV9‐NC and AAV9‐KD mice GAS muscle tissue (n = 4). D) Representative transmission electron microscopy (TEM) images of mitochondrial ultrastructure in GAS muscle tissue from WT and lncRNA‐MEG3 TG mice (n = 4). E) Quantification of mitochondrial density per µm2 in skeletal muscles in WT and lncRNA‐MEG3 TG mice (n = 4). F) ATP production levels in skeletal muscles in WT and TG mice (n = 4). G) qRT‐PCR showing the expression of lipid metabolism marker genes in muscles with lncRNA‐MEG3 knockdown or overexpression (n = 6). H,I) Representative BODIPY staining in C2C12 myotubes with lncRNA‐MEG3 knockdown or overexpression (n = 3). Scale bar = 100 µm. J) H&E staining of TA muscle at the 14 dpi after GLY injury with lncRNA‐MEG3 knockdown (n = 3). Scale bar = 100 µm. K) IF analysis of Perilipin‐1 (green) and DAPI (blue) at the 14 dpi after GLY injury in muscles with lncRNA‐MEG3 knockdown (n = 3). Scale bar = 100 µm. L,M) qRT‐PCR and Western blot analysis of muscle atrophy, lipid deposition, and mitochondrial biogenesis marker genes in TA muscles at the 14 dpi after GLY injury with lncRNA‐MEG3 knockdown (n = 6). N) H&E staining of TA muscle at the 14 dpi after GLY injury in WT and lncRNA‐MEG3 TG mice (n = 3). Scale bar = 100 µm. O) IF analysis of Perilipin‐1 (green) and DAPI (blue) at the 14 dpi after GLY injury in lncRNA‐MEG3 TG mice (n = 3). Scale bar = 100 µm. P,Q) qRT‐PCR and Western blot analysis of muscle atrophy, lipid deposition, and mitochondrial biogenesis marker genes in TA muscle at the 14 dpi after GLY injury in WT and lncRNA‐MEG3 TG mice (n = 6). Data are mean ± SD; p‐values were calculated using Student's t‐test. * p < 0.05, ** p < 0.01 and *** p < 0.001.
Figure 5
Figure 5
Characterization of the interaction between lncRNA‐MEG3 and SUZ12. A) RNA‐binding motif enrichment analysis showing the most frequently detected RNA‐binding proteins associated with lncRNA‐MEG3 by catRAPID (http://s.tartaglialab.com/page/catrapid_group). B) Fluorescent in situ hybridization (FISH) showing lncRNA‐MEG3 localization (green) in primary mouse myoblasts and C2C12 myoblasts. Nuclei are stained with DAPI (blue) (n = 3). Scale bar = 20 µm. C–E) RNA pull‐down assay of SUZ12, β‐actin (negative control), and GAPDH (negative control) using antisense and sense probes for lncRNA‐MEG3 in C2C12 myoblast lysates (n = 3). Input represents total lysates. F) Quantification of the lncRNA‐MEG3 interaction with SUZ12 normalized to input level (n = 3). G) Predicted secondary structure of lncRNA‐MEG3 highlighting structural domains (D1, D2, and D3). H) RNA pull‐down assay was performed to analyze the binding of lncRNA‐MEG3 WT, deletion expression vectors (D1, D2, and D3), and SUZ12 protein (n = 3). I,J) Domain mapping of SUZ12 using truncated fragments (B1, B2, and B3) in pull‐down assays, identifying the lncRNA‐MEG3 interaction domain in SUZ12 (n = 3). K) Schematic of the deletion constructs in the B3 domain, with the deleted regions located at the following amino acid positions: c1 (500‐550 aa deletion), c2 (551–600 aa deletion), c3 (601–650 aa deletion), c4 (651–700 aa deletion), and c5 (701–739 aa deletion). L) RNA pull‐down assay showing the interaction between biotinylated lncRNA‐MEG3 and the B3 domain deletion variants (n = 3). M) Schematic representation of SUZ12 domains, indicating the lncRNA‐MEG3 binding region and the EZH2/EED interaction region. N) Co‐IP was performed to analyze the interaction between SUZ12 and EZH2/EED after C2C12 myoblasts were treated with RNase T1, DNase I, and lncRNA‐MEG3 shRNA (n = 3). O) Co‐IP was performed to analyze the interaction between SUZ12 and EZH2/EED after overexpression of lncRNA‐MEG3 in C2C12 myoblasts (n = 3). P,Q) Co‐IP was performed to analyze the interaction between SUZ12 and EZH2/EED in C2C12 myoblasts with knockdown of lncRNA‐MEG3 (n = 3). R) IF staining of SUZ12 (red) in control and lncRNA‐MEG3‐overexpressing C2C12 cells showing enhanced nuclear localization. DAPI stains nuclei (blue) (n = 3). Scale bar = 20 µm. S) Western blot showing the expression of Suz12 in the nucleus, cytoplasm, and whole cell lysates of C2C12 myoblasts after lncRNA‐MEG3 overexpression (n = 3). Lamin B1 was used as a marker for the nuclear protein, α‐Tubulin as a marker for the cytoplasmic protein, and Gapdh as a marker for the total protein. Data are mean ± SD; p‐values were calculated using Student's t‐test. ** p < 0.01.
Figure 6
Figure 6
LncRNA‐MEG3 interacts with SUZ12 to regulate the H3K27me3 modification of the Fhl3 and Rnf128 promoter. A) Volcano plot showing differentially expressed genes upon SUZ12 knockdown. B) Gene Ontology (GO) enrichment analysis of DEGs, highlighting biological processes significantly affected by SUZ12 modulation. C) KEGG pathway enrichment analysis of DEGs, showing pathways related to muscle development and immune responses. D) Venn diagrams showing the overlap between DEGs (downregulated and upregulated) and H3K27me3 target genes, with bar plots displaying enriched pathways for overlapping genes. E) Schematic diagrams of Fhl3 and Rnf128 loci, illustrating H3K27me3 modification sites at their promoters. F) ChIP‐qPCR showing the enrichment of H3K27me3 at the Fhl3 promoter in Suz12 knockdown (KD) and overexpression (OV) myoblasts compared to controls (n = 3). G,H) qRT‐PCR (n = 6) (G) and Western blot (n = 3) (H) showing the expression levels of Fhl3 in Suz12 OV and KD myoblast. I) ChIP‐qPCR showing the enrichment of H3K27me3 at the Rnf128 promoter in lncRNA‐MEG3 knockdown (KD) and overexpression (OV) myoblasts compared to controls (n = 3). J,K) qRT‐PCR (n = 6) (J) and Western blot (n = 3) (K) showing the expression levels of Rnf128 in lncRNA‐MEG3 OV and KD myoblast. Data are mean ± SD; P‐values were calculated using Student's t‐test. * p < 0.05, ** p < 0.01 and *** p < 0.001.
Figure 7
Figure 7
SUZ12 undergoes LLPS. A) Identification of IDR within the SUZ12 protein using bioinformatics analysis. The IDR region (red box) and zinc finger (ZnF) domains are highlighted. B) IF showing SUZ12 (green) localization in C2C12 myoblasts. Nuclei are stained with DAPI (blue) (n = 3). Scale bar = 20 µm. C) GFP‐tagged SUZ12 exhibits nuclear localization in C2C12 myoblasts. DAPI stains nuclei (n = 3). Scale bar = 20 µm. D) Immunostaining of SUZ12 in C2C12 myoblasts treated with 1,6‐ethylene glycol, showing disrupted puncta formation. Quantification of SUZ12‐positive nuclear puncta per cell is shown (right panel) (n = 6). Scale bar = 10 µm. E) Fluorescence recovery after photobleaching (FRAP) of SUZ12 puncta in C2C12 myoblasts, demonstrating its liquid‐like properties. Representative images before and after bleaching are shown with recovery kinetics (right panel). Scale bar = 10 µm. F) Concentration‐dependent phase separation of purified SUZ12 protein in vitro. Representative images and quantification of puncta formation at increasing protein concentrations are shown (n = 6). Scale bar = 10 µm. G) Salt sensitivity assay showing SUZ12 puncta disruption with increasing NaCl concentrations (300 to 500 mm) (n = 6). Scale bar = 10 µm. H) pH‐dependent phase separation of SUZ12, showing optimal droplet formation at pH 6.0–6.5. Quantification of puncta is shown (right panel) (n = 6). Scale bar = 10 µm. I) FRAP analysis of SUZ12 droplets in vitro, demonstrating rapid fluorescence recovery after photobleaching, indicative of liquid‐like dynamics. Scale bar = 10 µm. J) Time‐lapse imaging of SUZ12 droplets coalescence in vitro, showing fusion events over time. K) Schematic of SUZ12 mutants (ΔIDR‐SUZ12, FUSIDR, and TIA1IDR) used to investigate the role of IDR in LLPS. L) IF of full‐length (FL) SUZ12 and ΔIDR‐SUZ12 in C2C12 myoblasts. ΔIDR‐SUZ12 lacks nuclear puncta formation. Quantification is shown (right panel) (n = 6). Scale bar = 10 µm. M) Representative images of GFP‐tagged SUZ12 different vectors in C2C12 myoblasts. Quantification of the puncta number is shown in the right panel (n = 6). Scale bar = 10 µm. N) Turbidity assay of purified SUZ12 protein in the presence of PEG8000, confirming its ability to undergo phase separation (n = 6). Data are mean ± SD; p‐values were calculated using Student's t‐test. * p < 0.05, ** p < 0.01 and *** p < 0.001.
Figure 8
Figure 8
LncRNA‐MEG3 enhances muscle function via SUZ12 LLPS‐mediated regulation of Fhl3 and Suz12. A) Representative immunostaining for Myh7, Myh4 in C2C12 myoblasts after co‐transfected with NC, lncRNA‐MEG3 overexpression vector (lncRNA‐MEG3 OV), lncRNA‐MEG3 OV + Fhl3 overexpression vector (Fhl3 OV), lncRNA‐MEG3 OV + Fhl3 OV + Suz12 overexpression vector (Suz12 OV), lncRNA‐MEG3 OV + Fhl3 OV + Suz12 deleted IDR region overexpression vector (ΔIDR‐Suz12 OV) (n = 3). Scale bar = 100 µm. B) Representative ORO staining and immunostaining for Myhc in C2C12 myoblasts after co‐transfected with NC, lncRNA‐MEG3 OV, lncRNA‐MEG3 OV + Rnf128 overexpression vector (Rnf128 OV), lncRNA‐MEG3 OV + Rnf128 OV + Suz12 OV, lncRNA‐MEG3 OV + Rnf128 OV +ΔIDR‐Suz12 OV (n = 3). Scale bar = 100 µm. C,D) ATP synthesis and cAMP biogenesis detection after co‐transfected with NC, lncRNA‐MEG3 OV, lncRNA‐MEG3 OV + Fhl3 OV, lncRNA‐MEG3 OV + Fhl3 OV + Suz12 OV, lncRNA‐MEG3 OV + Fhl3 OV +ΔIDR‐Suz12 OV in C2C12 myoblasts (n = 3). E,F) ATP synthesis and cAMP biogenesis detection after co‐transfected with NC, lncRNA‐MEG3 OV, lncRNA‐MEG3 OV + Rnf128 OV, lncRNA‐MEG3 OV + Rnf128 OV + Suz12 OV, lncRNA‐MEG3 OV + Rnf128 OV +ΔIDR‐Suz12 OV in C2C12 myoblasts (n = 3). G) qRT‐PCR analysis of the expression of marker genes related to muscle atrophy, fat deposition, muscle fiber type conversion, and mitochondrial biogenesis in C2C12 myoblasts after co‐transfected with NC, lncRNA‐MEG3 OV, lncRNA‐MEG3 OV + Fhl3 OV, lncRNA‐MEG3 OV + Fhl3 OV + Suz12 OV, lncRNA‐MEG3 OV + Fhl3 OV +ΔIDR‐Suz12 OV (n = 6). (H) qRT‐PCR analysis of marker gene expression related to muscle atrophy, fat deposition, muscle differentiation, and mitochondrial biogenesis in C2C12 myoblasts after co‐transfected with NC, lncRNA‐MEG3 OV, lncRNA‐MEG3 OV + Rnf128 OV, lncRNA‐MEG3 OV + Rnf128 OV + Suz12 OV, lncRNA‐MEG3 OV + Rnf128 OV +ΔIDR‐Suz12 OV (n = 6). I) qRT‐PCR showing lncRNA‐MEG3 expression after C2C12 myoblasts treated with culture media for different cancer cell lines (n = 3). J) qRT‐PCR showing lncRNA‐MEG3 expression after C2C12 myoblasts treated with different cytokines (n = 3). Data are mean ± SD; p‐values were calculated using Student's t‐test. * p < 0.05, ** p < 0.01 and *** p < 0.001.
Figure 9
Figure 9
Schematic illustration of the role and mechanism of energy metabolism reprogramming. Triggered by lncRNA‐MEG3 overexpression in skeletal muscle. LncRNA‐MEG3 is specifically induced in skeletal muscle in response to normal muscle development, stimulating the translocation and accumulation of SUZ12 protein in the nucleus, where it condenses into liquid droplets through the mechanism of LLPS. lncRNA‐MEG3 acts as a scaffold, recruiting SUZ12 and increasing its local concentration, promoting its interaction with EED and EZH2. This complex is sequestered together in the droplets, forming membrane‐less subcellular compartments, which catalyze the enhancement of H3K27me3, thereby inhibiting the transcriptional activity of downstream target genes. Through this mechanism, lncRNA‐MEG3 promotes Suz12 phase separation, suppressing the expression of Fhl3 and Rnf128, and further affecting the expression of genes involved in lipid metabolism, muscle atrophy, muscle fiber type conversion, and mitochondrial biogenesis, such as Nrf1, Myh7, Myh4, Adipoq, and Fabp4. These drive enhanced skeletal muscle mass and endurance, inhibit fat infiltration, and prevent muscle atrophy.

Similar articles

References

    1. Mathes S., Fahrner A., Ghoshdastider U., Rüdiger H. A., Leunig M., Wolfrum C., Krützfeldt J., Proc. Natl. Acad. Sci. USA 2021, 118, 2021013118. - PMC - PubMed
    1. Biltz N. K., Collins K. H., Shen K. C., Schwartz K., Harris C. A., Meyer G. A., J. Physiol. 2020, 598, 2669. - PMC - PubMed
    1. Rosa‐Caldwell M. E., Lim S., Haynie W. A., Brown J. L., Deaver J. W., Da Silva F. M., Jansen L. T., Lee D. E., Wiggs M. P., Washington T. A., Greene N. P., J. Cachexia Sarcopenia Muscle 2021, 12, 717. - PMC - PubMed
    1. Chen X., Ji Y., Liu R., Zhu X., Wang K., Yang X., Liu B., Gao Z., Huang Y., Shen Y., Liu H., Sun H., J. Transl. Med. 2023, 21, 503. - PMC - PubMed
    1. Fatica A., Bozzoni I., Nat. Rev. Genet. 2014, 15, 7. - PubMed

Substances

LinkOut - more resources