. 2025 Jul;12(25):e2501033.
doi: 10.1002/advs.202501033. Epub 2025 Apr 26.

In Vivo Cytosolic Delivery of Biomolecules into Neurons for Super-Resolution Imaging and Genome Modification

Affiliations

In Vivo Cytosolic Delivery of Biomolecules into Neurons for Super-Resolution Imaging and Genome Modification

Xiaoqian Ge et al. Adv Sci (Weinh). 2025 Jul.

Abstract

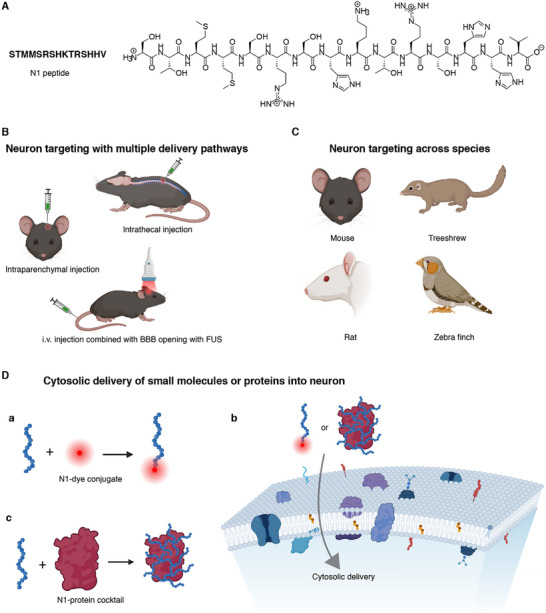
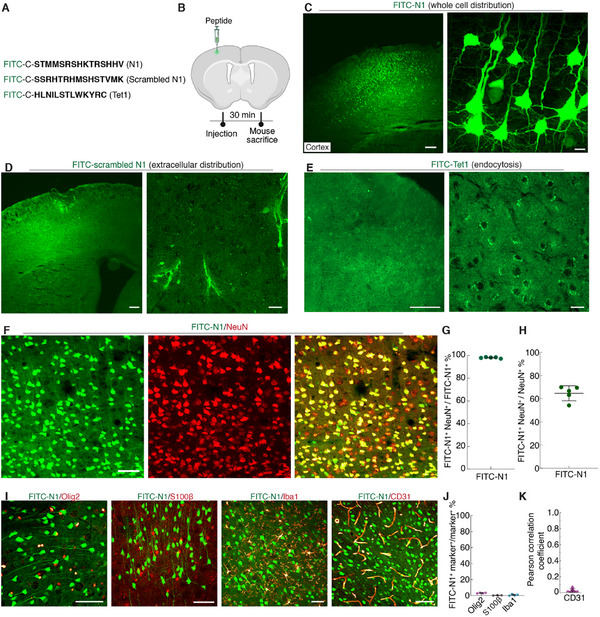
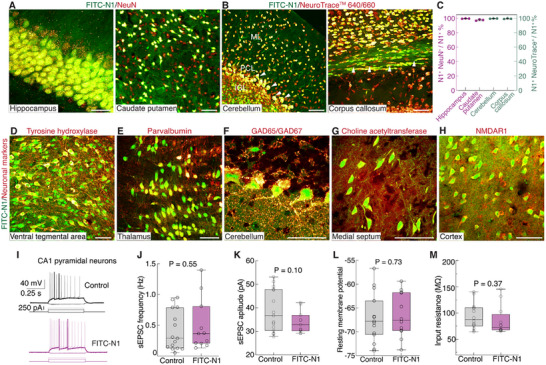
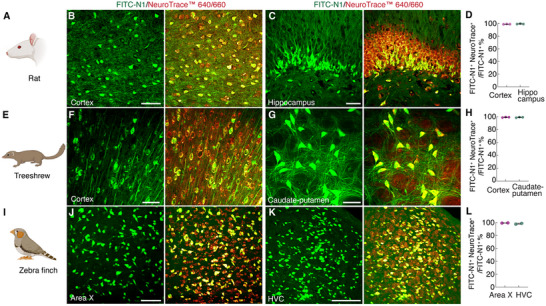
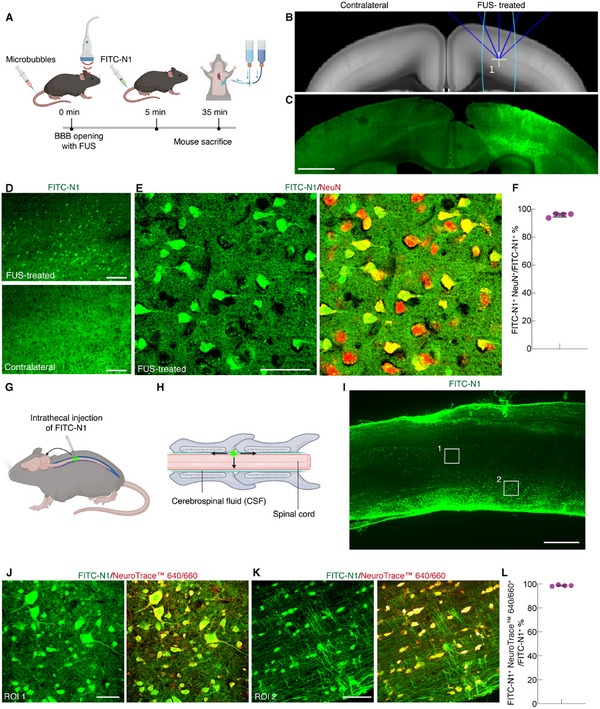
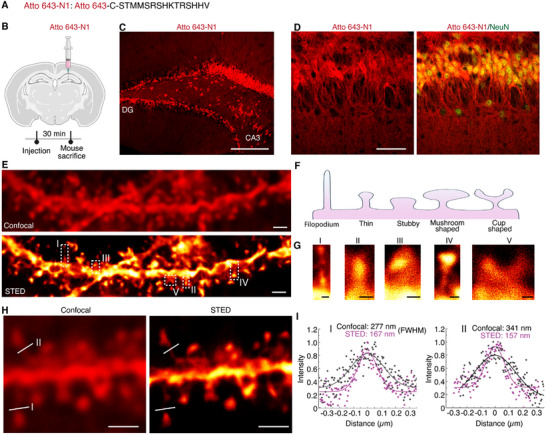
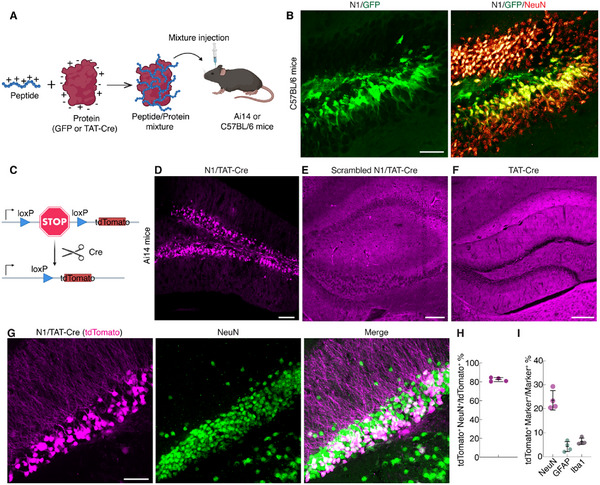
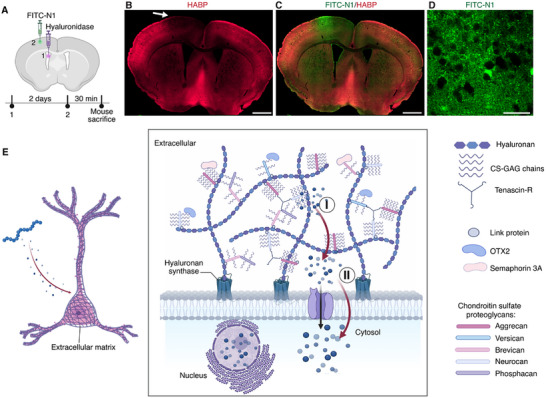
Efficient delivery of biomolecules into neurons has significant impacts on therapeutic applications in the central nervous system (CNS) and fundamental neuroscience research. Existing viral and non-viral delivery methods often suffer from inefficient intracellular access due to the endocytic pathway. Here, a neuron-targeting and direct cytosolic delivery platform is discovered by using a 15-amino-acid peptide, termed the N1 peptide, which enables neuron-specific targeting and cytosolic delivery of functional biomolecules. The N1 peptide initially binds hyaluronan in the extracellular matrix and subsequently passes the membrane of neurons without being trapped into endosome. This mechanism facilitates the efficient delivery of cell-impermeable and photo-stable fluorescent dye for super-resolution imaging of dendritic spines, and functional proteins, such as Cre recombinase, for site-specific genome modification. Importantly, the N1 peptide exhibits robust neuronal specificity across diverse species, including mice, rats, tree shrews, and zebra finches. Its targeting capability is further demonstrated through various administration routes, including intraparenchymal, intrathecal, and intravenous (i.v.) injections after blood-brain barrier (BBB) opening with focused ultrasound (FUS). These findings establish the N1 peptide as a versatile and functional platform with significant potential for bioimaging and advanced therapeutic applications.

Keywords: across species; genome modification; neuron specific targeting; peptides; super‐resolution imaging.


Conflict of interest statement

The authors declare no conflict of interest.

Figures

Figure 1
Figure 1
Overview of the N1 peptide for neuron‐specific labeling and cytosolic delivery of biomolecules. A) Amino acid sequence and chemical structure of the N1 peptide. B) N1 peptide achieves neuron‐specific targeting through multiple delivery routes, including intraparenchymal injection, intrathecal injection, and i.v. injection combined with BBB opening via FUS. C) Demonstration of cross‐species neuronal targeting by N1 peptide in mouse, rat, tree shrew, and zebra finch. D) The N1 peptide facilitates the delivery of small molecules and proteins into neurons. a) Small molecules conjugated to the N‐terminus of the N1 peptide, b) proteins mixed with N1 peptide via a cocktail approach without direct conjugation, and c) N1 conjugates or N1‐protein cocktails enter neuronal cytosol. The precise targeting mechanism remains to be identified. Once inside, N1 conjugates or N1‐protein cocktails distribute throughout the neuron, reaching both the cytosol and the nucleus.
Figure 2
Figure 2
Neuron‐specific targeting and endosome‐independent cytosolic entry of the N1 peptide. A) Amino acid sequences of N1 peptide, Scrambled N1, and Tet1 peptide. For fluorescent visualization, fluorescein (FITC) was conjugated with an additional cysteine at the N‐terminus. B) Schematic representation of the intracerebral injection of FITC‐N1, FITC‐scrambled N1, or FITC‐Tet1 into the mouse cortex. Mice were sacrificed 30 min post‐injection to examine the cellular uptake of peptides. C–E) Representative images of mouse cortex labeled with C) FITC‐N1, D) FITC‐scrambled N1, or E) FITC‐Tet1 peptide. Left: low‐magnification images; right: high‐magnification image. F) Maximum intensity projection images of cortical tissue labeled with FITC‐N1 and counterstained with NeuN, showing significant colocalization. G) The proportion of FITC‐N1+ cells colocalized with NeuN+ cells relative to the total number of FITC‐N1+ cells. H) The percentage of NeuN+ cells labeled with FITC‐N1+ cells relative to the total number of NeuN+ cells. Data in G and H are presented as mean ± s.d. (n = 5 animals). See Table S2 (Supporting Information) for detailed statistics. I) Maximum intensity projection images of cortical sections labeled with FITC‐N1 and counterstained with markers for specific cell types: Olig2 (oligodendrocytes), S100β+ (astrocytes), Iba1 (microglia), and CD31 (endothelial cells). J) Quantitative analysis confirmed the lack of colocalization between FITC‐N1+ cells and Olig2+, S100β+, and Iba1+ populations, based on analysis of 2061 Olig2+ cells (four animals), 1 837 S100β+ cells (three animals), and 801 Iba1+ cells (four animals), mean ± s.d. See Table S3 (Supporting Information) for detailed statistics. K) Due to challenges associated with counting CD31+ cells, Pearson's correlation coefficient (PCC, range − 1–1) was analyzed from 42 image pairs (n = 4 animals, mean ± s.d.), indicating no uptake of FITC‐N1 by endothelial cells. Scale bars: (C–E) left: 0.5 mm; right: 50 µm (F and I) 50 µm.
Figure 3
Figure 3
N1 peptide labels neurons across brain regions and neuronal subtypes without impacting electrophysiological properties. A,B) Images (maximum intensity projection) showing significant overlap of FITC‐N1 labeling with NeuN or NeuroTrace™ 640/660 staining, demonstrating high neuronal specificity of FITC‐N1 across brain regions. A) Hippocampus and caudate‐putamen. B) Cerebellum and corpus callosum. C) Quantification of the neuronal specificity of FITC‐N1 across brain regions, calculated as the number of FITC‐N1+ cells colocalized with NeuN+ cells or NeuroTrace™ 640/660+ cells relative to the total number of FITC‐N1+ cells. A total of 1011, 1219, 1069, and 401 FITC‐N1+ cells were analyzed for hippocampus, caudate‐putamen, cerebellum, and corpus callosum, respectively. Data are presented as mean ± s.d., n = 3 animals. See detailed statistics in Table S4 (Supporting Information). D–H) Images (maximum intensity projection) show that FITC‐N1+ cells in various brain regions colocalize with different neuronal markers+ cells, D) The ventral tegmental area for catecholaminergic neurons), E) The reticular nucleus of the thalamus for parvalbumin neurons), F) The cerebellum for GABAergic neurons), G) The medial septum for cholinergic neurons, and H) The cortex for glutamatergic neurons. Antibodies against tyrosine hydroxylase, parvalbumin, glutamic acid decarboxylase 65/67 (GAD65/GAD67), choline acetyltransferase, and N‐methyl D‐aspartate receptor subtype 1 (NMDAR1) were used. I) Representative membrane potential traces in response to current steps recorded from CA1 pyramidal neurons with or without FITC‐N1 labeling (control). J–M) Quantification of spontaneous excitatory postsynaptic currents (sEPSC) frequency (J, n = 11 cells for FITC‐N1, and 15 for control), sEPSC amplitude (K, n = 11 cells for FITC‐N1, and 15 for control), resting membrane potential (L, n = 12 FITC‐N1‐labeled cells, 14 for control), and input resistance (M, n = 12 for FITC‐N1, and 13 for control), showing no significant differences between FITC‐N1‐labeled and unlabeled neurons. Data are presented as box‐whisker plots (min to max, the middle line indicating median value; Student's t‐test). Scale bars: (Left image in A) 20 µm; (Right image in A, B, and D–H) 50 µm.
Figure 4
Figure 4
N1 peptide specifically targets neurons across species. FITC‐N1 was administered intracerebrally into the cortex and hippocampus of rats, the cortex and caudate‐putamen of treeshrews, and the area X and HVC of zebra finches. B,C,F,G,J,K) Images (maximum intensity projection) demonstrating specific labeling of neurons by FITC‐N1 in these species, as confirmed by significant colocalization with NeuroTrace™ 640/660+ cells. D,H,L) Quantification of the neuronal specificity of FITC‐N1 across species, calculated as the number of FITC‐N1+ cells colocalized with NeuroTrace™ 640/660+ cells relative to the total number of FITC‐N1+ cells. Data are presented as mean ± s.d., n = 3 animals for rats, n = 3 animals for treeshews, and n = 2 animals for zebra finches. Detailed statistics are listed in Table S5 (Supporting Information). Scale bars: 50 µm.
Figure 5
Figure 5
Selective neuronal uptake of N1 peptide after systemic administration coupled with FUS‐mediated BBB opening, and intrathecal administration into the spinal cord. A) Schematic timeline illustrating the process of FUS‐mediated BBB opening facilitated by microbubbles, systemic administration of FITC‐N1, and its subsequent specific delivery to the brain parenchyma. B) Mouse brain atlas indicating the trajectory of ultrasound waves from the transducer (blue lines) and the targeted area (cyan ellipse). C) Large field‐of‐view image showing the area labeled with FITC‐N1 following FUS‐mediated BBB opening (FUS‐treated), with the contralateral side (without FUS treatment) serving as the control. D) Zoomed views of the FUS‐treated area and the contralateral control side. E) High‐magnification images (maximum intensity projection) illustrating the neuronal specificity of FITC‐N1 after FUS‐facilitated BBB opening, confirmed by colocalization with the neuronal marker NeuN. F) The percentage of FITC‐N1+ cells colocalized with NeuN+ cells relative to the total number of FITC‐N1+ cells. A total of 776 FITC‐N1+ cells were analyzed and data are presented as mean ± s.d., n = 4 animals. G) Schematic representation of intrathecal injection of FITC‐N1 between the lumbar 3 (L3) and lumbar 5 (L5) vertebral levels. H) Upon intrathecal injection, FITC‐N1 diffuses within the cerebrospinal fluid (CSF), leading to its distribution in the brain and penetration into the spinal cord. I) Image of a sagittal spinal cord section labeled with FITC‐N1 after intrathecal injection. J,K) Images (maximum intensity projection) showing the neuronal specificity of FITC‐N1 in the spinal cord after intrathecal injection, confirmed by colocalization of FITC‐N1+ cells and NeuroTrace™ 640/660+ cells. J) was acquired from the gray matter (ROI1) and K) from the white matter (ROI2) in (I). White boxes in (I) do not indicate the actual size of images (J) and (K). L) Quantification of the percentage of FITC‐N1+ cells colocalized with NeuroTrace™ 640/660+ cells relative to the total number of FITC‐N1+ cells. A total of 753 FITC‐N1+ cells were analyzed. Data are presented as mean ± s.d., n = 4 animals. Scale bars: C) 1 mm; I) 0.5 mm; D) 200 µm; E,J,K) 50 µm.
Figure 6
Figure 6
Super‐resolution imaging of dendritic spines using N1 peptide. A) The amino acid sequence of the Atto 643 dye conjugated N1 peptide. B) Schematic representation of Atto 643‐N1 injection into the hippocampus, with mice sacrificed 30 min after injection. C) Low magnification image showing widespread labeling of hippocampal regions by Atto 643‐N1. D) NeuN staining confirmed the neuronal specificity of Atto 643‐N1 labeling in hippocampal neurons. E) Representative confocal (top) and STED (bottom) images of a dendrite labeled with Atto 643‐N1. F) Schematic illustration of five classifications of dendritic spine shapes: filopodium, thin, stubby, mushroom‐shaped, and cup‐shaped. G) STED images depicting the five spine shape classes, extracted from regions I, II, III, IV, and V of STED image in E. H) Magnified views showing a comparison between confocal and STED images of dendrite spines. I) Intensity line profiles measured along white lines I and II in H. Confocal (gray), STED (pink), solid lines represent Gaussian fits to the raw data. The full width at half maximum (FWHM) was used to determine the width of the analyzed structures. Scale bars: C) 200 µm; D) 50 µm; E) 2 µm; G) 200 nm; H) 500 nm.
Figure 7
Figure 7
N1 peptide enables selective delivery of proteins into hippocampal neurons. A) Schematic illustration of intracerebral injection of peptide/protein mixture (without conjugation) into hippocampal neurons. Mixture of GFP /N1 was administered to C57BL/6 mice. Mixtures of N1/TAT‐Cre, scrambled‐N1/TAT‐Cre, and TAT‐Cre alone were injected into Cre reporter Ai14 mice. B) Images of a hippocampal section after delivery of N1/GFP, followed by NeuN staining, showing significant colocalization of GFP+ cells and NeuN+ cells. C) Schematic showing of Cre reporter Ai14 mice, which have a loxP‐flanked STOP cassette preventing expression of tdTomato fluorescent protein. With Cre‐mediated recombination, it expresses robust tdTomato fluorescence. D) Successful Cre‐mediated recombination and tdTomato expression occurred only with the N1/TAT‐Cre mixture, but not the control conditions (E) scrambled N1/TAT‐Cre, and F) TAT‐Cre alone). G) NeuN staining showed that tdTomato+ cells significantly colocalized with NeuN+ cells, with the injection of N1/TAT‐Cre into the hippocampus of Ai14 mice. H) Neuronal recombination specificity of N1/TAT‐Cre, calculated as the percentage of tdTomato+ cells colocalized with NeuN+ cells relative to the total number of tdTomato+ cells. A total of 905 tdTomato+ cells were analyzed, mean ± s.d., n = 4 animals. I) Proportion of tdTomato+ cells colocalized with NeuN+ cells, GFAP+ cells, or Iba1+ cells, relative to the total number of NeuN+ cells, GFAP+ cells, or Iba1+ cells. A total of 3 864 NeuN+ cells, 1 028 GFAP+ cells, and 529 Iba1+ cells were analyzed, mean ± s.d., n = 4 animals. Scale bars: B,G) 50 µm; D–F) 100 µm.
Figure 8
Figure 8
Two‐step entry mechanism of N1 peptide. A) Schematic showing of hyaluronidase injected into the lateral ventricle to deplete hyaluronan within 2 days, followed by administration of FITC‐N1 into the cortex 30 min before mouse sacrifice. B) Hyaluronan loss was observed across a large brain area, confirmed by the reduced HABP staining near the ventricle. The arrow indicates the cortical injection site of FITC‐N1 following hyaluronan depletion. C) Merged image of HABP staining and FITC‐N1 lebeling. D) High‐resolution images showing FITC‐N1 only exists in the extracellular space instead of neurons in the cortex. E) Two‐step targeting mechanism for N1 peptide's cytosolic entry. Initially, N1 peptide binds the hyaluronan (step I). Afterward, the N1 peptide diffuses to the surface and the cytosolic entry was mediated by neuron‐specific transporters or specialized membrane channels (step II). Once inside cytosol, the N1 peptide diffuses throughout the whole cytosol and enters the nucleus.

Similar articles

References

    1. Birnie M. T., Baram T. Z., Science 2022, 376, 1055. - PMC - PubMed
    1. Malezieux M., Klein A. S., Gogolla N., Annu. Rev. Neurosci. 2023, 46, 211. - PubMed
    1. Wang B., Torok Z., Duffy A., Bell D. G., Wongso S., Velho T. A. F., Fairhall A. L., Lois C., Nat. Neurosci. 2024, 27, 1176. - PubMed
    1. Garcia‐Chica J., DParaiso W. K., Tanabe S., Serra D., Herrero L., Casals N., Garcia J., Ariza X., Quader S., Rodriguez‐Rodriguez R., Nanomedicine 2020, 15, 1617. - PubMed
    1. Dejanovic B., Sheng M., Hanson J. E., Nat. Rev. Drug Discovery 2024, 23, 23. - PubMed

LinkOut - more resources