. 2025 May;12(20):e2412505.
doi: 10.1002/advs.202412505. Epub 2025 Apr 26.

Tumoroid Model Reveals Synergistic Impairment of Metabolism by Iron Chelators and Temozolomide in Chemo-Resistant Patient-derived Glioblastoma Cells

Affiliations

Tumoroid Model Reveals Synergistic Impairment of Metabolism by Iron Chelators and Temozolomide in Chemo-Resistant Patient-derived Glioblastoma Cells

Meitham Amereh et al. Adv Sci (Weinh). 2025 May.

Abstract

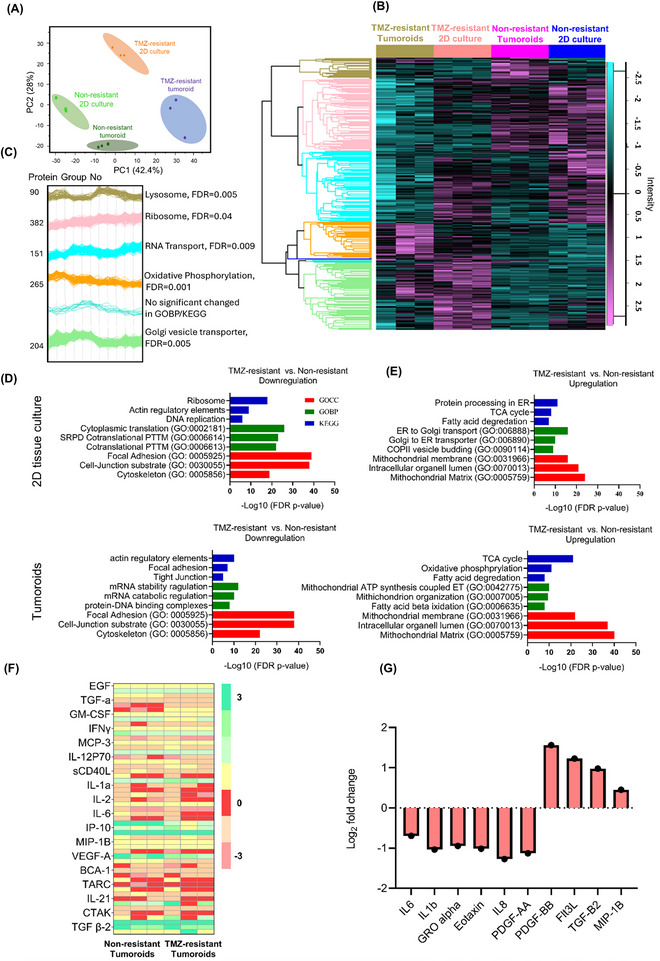
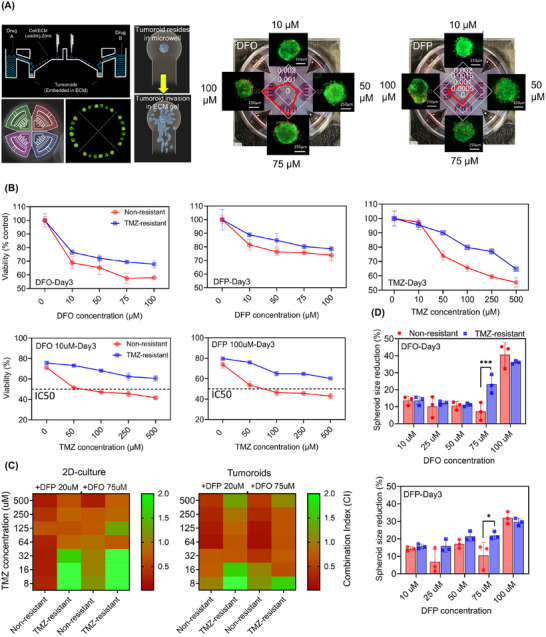
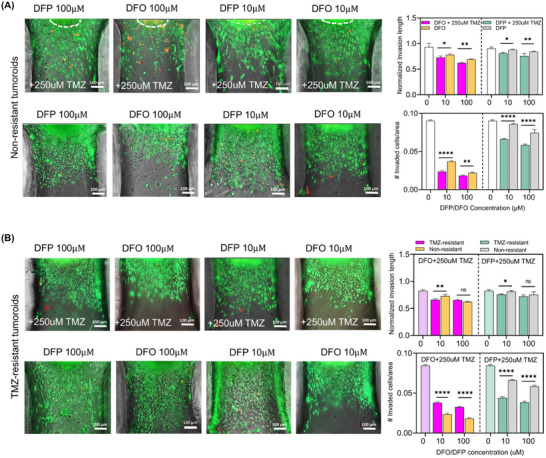
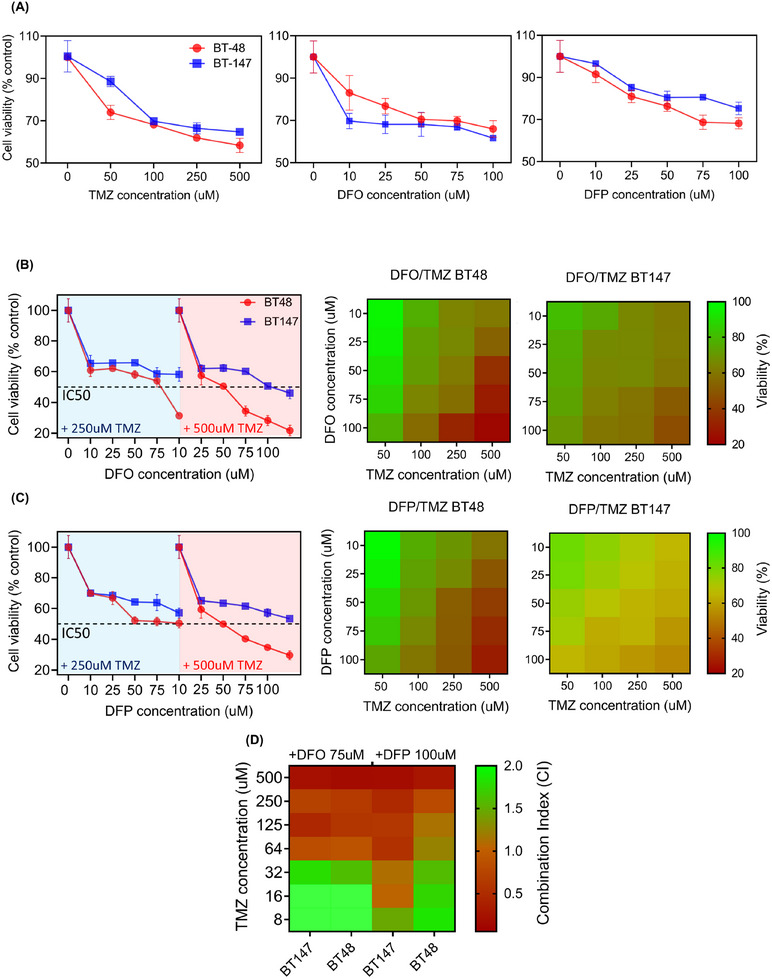
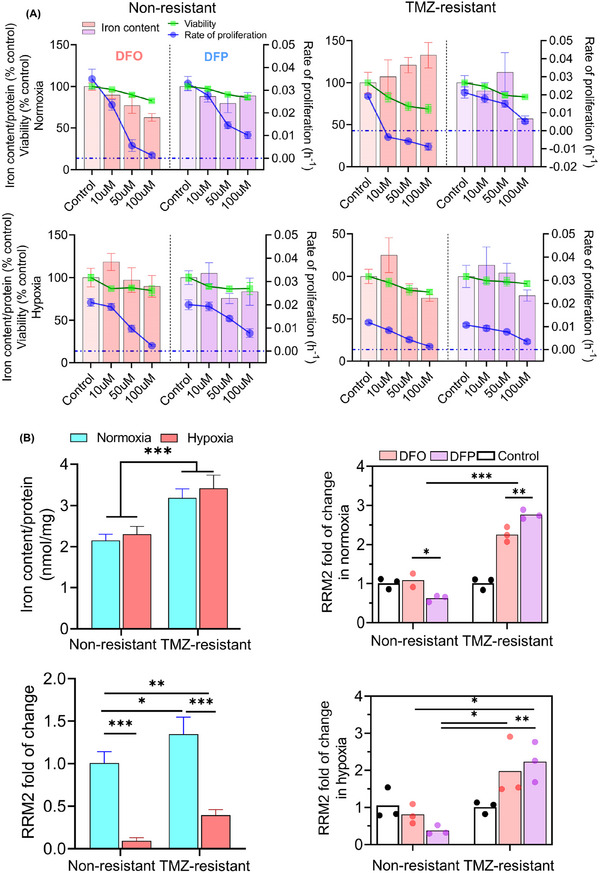
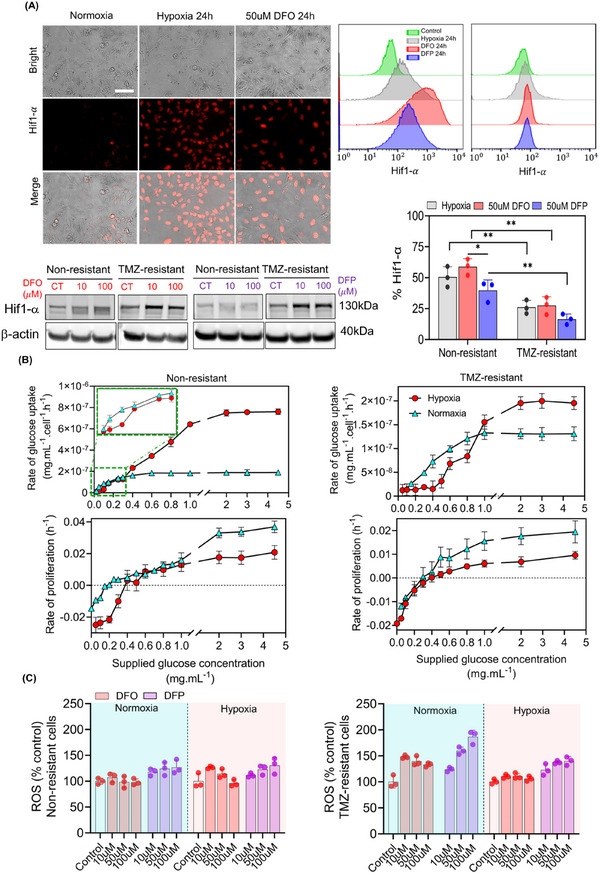
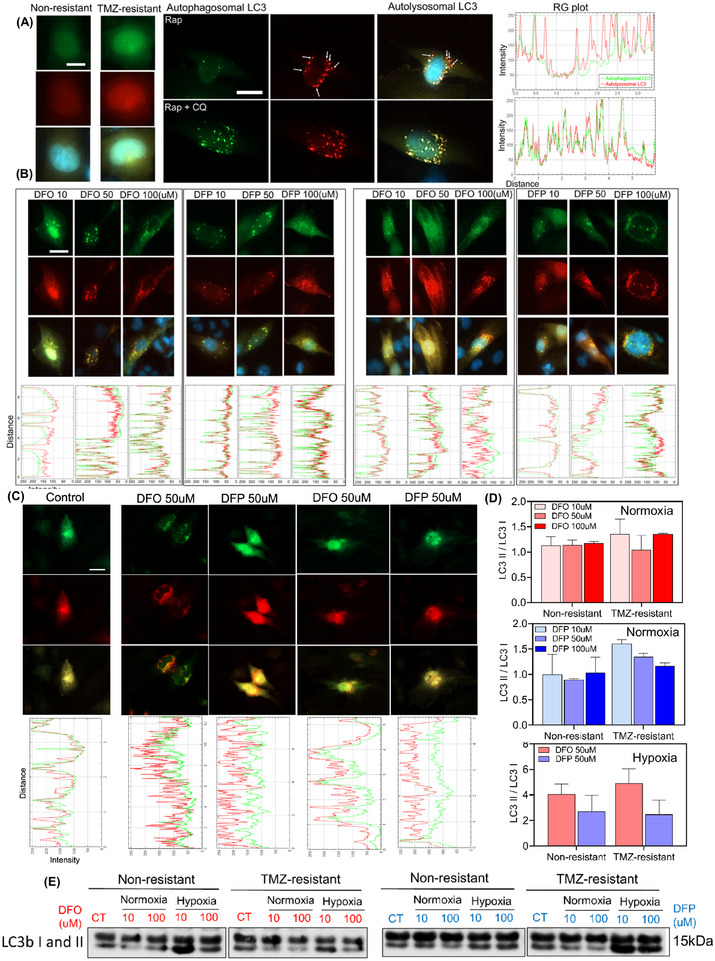
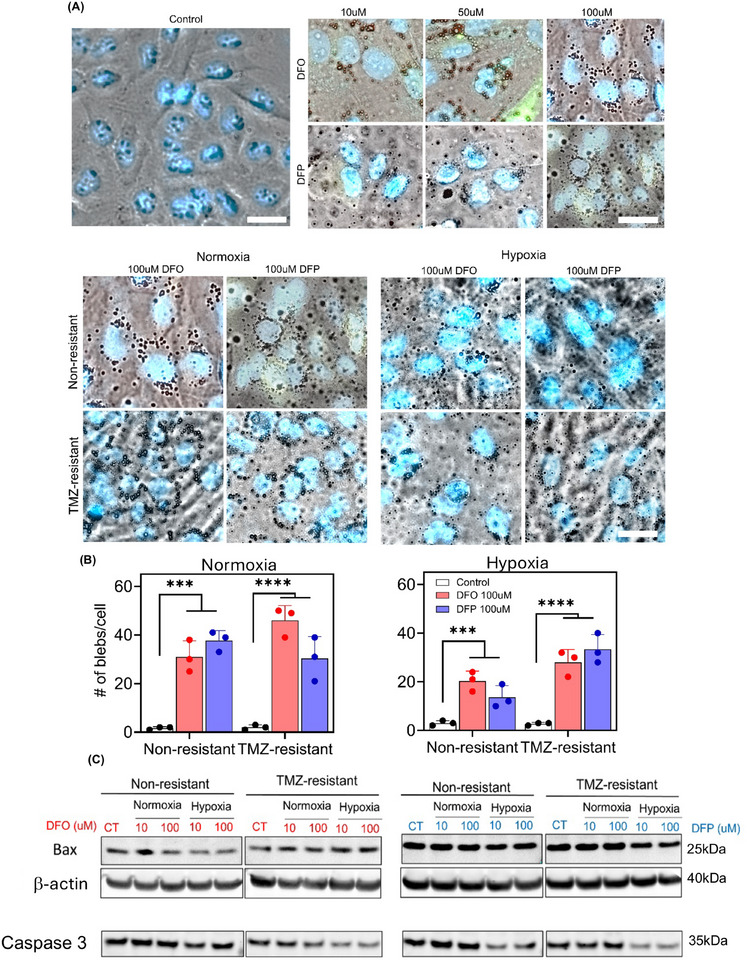
Chemoresistance poses a significant clinical challenge in managing glioblastoma (GBM), limiting the long-term success of traditional treatments. Here, a 3D tumoroid model is used to investigate the metabolic sensitivity of temozolomide (TMZ)-resistant GBM cells to iron chelation by deferoxamine (DFO) and deferiprone (DFP). This work shows that TMZ-resistant GBM cells acquire stem-like characteristics, higher intracellular iron levels, higher expression of aconitase, and elevated reliance on oxidative phosphorylation and proteins associated with iron metabolism. Using a microphysiological model of GBM-on-a-chip consisting of extracellular matrix (ECM)-incorporated tumoroids, this work demonstrates that the combination of iron chelators with TMZ induces a synergistic effect on an in vitro tumoroid model of newly diagnosed and recurrent chemo-resistant patient-derived GBM and reduced their size and invasion. Investigating downstream metabolic variations reveal reduced intracellular iron, increased reactive oxygen species (ROS), upregulated hypoxia-inducible factor-1α, reduced viability, increased autophagy, upregulated ribonucleotide reductase (RRM2), arrested proliferation, and induced cell death in normoxic TMZ-resistant cells. Hypoxic cells, while showing similar results, display reduced responses to iron deficiency, less blebbing, and an induced autophagic flux, suggesting an adaptive mechanism associated with hypoxia. These findings show that co-treatment with iron chelators and TMZ induces a synergistic effect, making this combination a promising GBM therapy.

Keywords: chemoresistance; glioblastoma; iron metabolism; metabolic sensitivity; tumoroid model.


Conflict of interest statement

Authors declare that they have no competing interests.

Figures

Figure 1
Figure 1
Global characterization and molecular signature of U251 non‐resistant and resistant in 2D and 3D models. A) Principal component analysis demonstrates a clear distinction between the proteomes of 2D tissue culture and 3D tumoroid in non‐resistant and TMZ‐resistant samples. B) Hierarchical clustering of normalized protein concentrations. Each raw represents a distinct protein and each column represents a sample (N = 3 biological independent experiment and one‐way ANOVA: Benjamini–Hochberg FDR = 0.05). C) Protein expression profiles for each cluster and the most enriched KEGG/GOBP per cluster is shown on the right side of each profile. D,E) The three most significant GO terms and KEGG pathways that upregulated or downregulated in each group emerged from the enrichment analysis of the genes identified by student t‐test. F) Hierarchical clustering of normalized cytokine concentrations. Each raw represents a distinct cytokine and each column represents a sample (significant cytokine was extracted based on the difference in their expression values with log2 fold change ≥ 2, FDR = 0.001). G) Cytokine profile comparing non‐resistant and TMZ‐resistant tumoroids, N = 3 biological independent experiment.
Figure 2
Figure 2
Cotreatment of TMZ‐resistant tumoroids with iron chelators and TMZ shows synergic effects. In‐vitro hGBM tumoroid in‐a‐well model was used to recapitulate the physiological relevant condition. A) Schematic side‐view of the microfluidic‐integrated culture plate (MiCP) for tumoroid array fabrication. Live‐dead (red) fluorescent imaging of tumoroids in each quadrant of the MiCP after treatment with varying concentrations of DFO and DFP along with semi‐quantified dead cells within the tumoroids. B) Change in the viability of tumoroids in response to single treatments (top panels) and combinations of either DFO or DFP with TMZ (bottom panels). C) Heat maps of CI index variation for combinations of DFO or DFP with varying concentrations of TMZ in 2D‐cultre (left) and 3D‐model (right). D) Size reduction in tumoroids in response to diffident dosages of DFO (top) and DFP (bottom). N = 3 biological independent experiments and statistically significant at *p‐value < 0.05 and *** p‐value < 0.001.
Figure 3
Figure 3
Tumoroids‐in‐a‐well model enables invasion analysis of the ECM enclosed tumor models in response to the different combination treatment conditions. A) Fluorescent images of the invaded non‐resistant tumor cells from the tumoroid with the ECM matrix in response to different combined and single treatment conditions. B) Fluorescent images of the invaded resistant tumor cells from the tumoroid with the ECM matrix in response to different combined and single treatment conditions. Invasion behavior of the tumoroids within the matrix was quantified through measurement of the relative invasion length of them compared to the primary tumoroid size and number of invaded cells per certain area.[ 114 ] N = 3 biological independent experiments and statistically significant at *p‐value < 0.05, **p‐value < 0.01, ***p‐value < 0.001, and ****p‐value < 0.0001.
Figure 4
Figure 4
Co‐treatment of glioblastoma patient‐derived tumoroid with TMZ and iron chelators induced synergic effect. A) Change in viability in response to single treatment of (left to right) TMZ, DFO, and DFP. B) The IC50 values were associated to the combination of 250 mM TMZ + 100 mM DFO and 500 mM TMZ + 50,75100 mM DFO in non‐resistant tumoroids, and only 500 mM TMZ + 100 mM DFO in recurrent tumoroids. C) Additionally, the IC50 values were obtained for the combination of 500 mM TMZ + 25, 50, 75, and 100 mM DFP in non‐resistant tumoroids. D) Heat maps of CI index variation for combinations of DFO or DFP with varying concentrations of TMZ in patient‐derived tumoroids. N = 3 biological independent experiments.
Figure 5
Figure 5
TMZ‐resistant cells exhibited different pattern of variations of in viability, proliferation rate, and ribonucleotide reductase mRNA (RRM2) expression. A) Both chelators decreased viability and proliferation, with DFO showing greater efficacy, particularly in normoxic TMZ‐resistant cells. DFO reduced intracellular iron in normoxic non‐resistant cells but increased intracellular iron in TMZ‐resistant cells. Hypoxic cells showed increased resistance to chelators (A‐bottom panels). Notably, TMZ‐resistant cells exhibited higher intracellular iron (B‐top left). Furthermore, TMZ‐resistant cells upregulated RRM2 expression in both normoxia and hypoxia (B‐bottom left). Similar trend was observed in TMZ‐resistant cells in response to DFO and DFP in both normoxia and hypoxia (B‐right panels). Both chelators changed RRM2 expression, with DFP showing a stronger effect. In non‐resistant cells, RRM2 expression decreased with chelator treatment, more significantly with DFO. N = 3 biological independent experiments and statistically significant at *p‐value < 0.05, **p‐value < 0.01, ***p‐value < 0.001, and ****p‐value < 0.0001.
Figure 6
Figure 6
DFO and DFP upregulate Hif1‐α expression and ROS generation in non‐resistant and TMZ‐resistant cells. A) Hif1‐α expression, imaged by IF microscopy (A‐left panels) and flow cytometry (A‐right panels) as well as western blotting (the protein, for the same experimental conditions across the lanes, came from the same lysate master mix, used in this figure and in Figures 7 and 8), revealed upregulation in response to 24 h of hypoxia and 50 µM DFO and DFP treatments. Flow cytometry quantification of Hif‐1α accumulation, indicating higher levels in DFO‐treated non‐resistant cells compared to DFP and hypoxia, with a similar trend observed in TMZ‐resistant cells. Glucose uptake analyses (B‐top panels) highlighted a pronounced difference between non‐resistant and TMZ‐resistant cells, with varying glucose concentrations affecting proliferation rates (B‐bottom panels), suggesting a critical threshold and different responses under hypoxic and normoxic conditions. This denotes the high sensitivity of normoxic TMZ‐resistant cell to DFO. In contrast, hypoxic TMZ‐resistant cells were less sensitive to all tested concentrations of DFO and DFP. C) Non‐monotonic dose‐dependent increase of ROS in DFO‐treated non‐resistant and TMZ‐resistant cells. DFP induced increases in ROS across all conditions. Hypoxia reduced the effect of both DFO and DFP in TMZ‐resistant cells. N = 3 biological independent experiments and statistically significant at *p‐value < 0.05 and **p‐value < 0.01. Scale bar is 100 µm.
Figure 7
Figure 7
DFO and DFP induce autophagy but inhibit autophagic flux in normoxia, whereas they induce autophagy and regulate the autophagic flux in hypoxia. A) Autophagic flux visualization using GFP‐RFP‐LC3 adenovirus in U251 NR and TMZ‐resistant cells. Positive control cells treated with 750 nM Rap and 750 nM Rap + 30 µM CQ. The autophagic flux was observed by imaging autolysosomes (red puncta) in cells treated with Rap, while autophagy inhibition was monitored by localized mRFP/GFP (yellow puncta) in Rap + CQ treated cells. B‐left) Effects of 10, 50, and 100 µM of DFO and DFP treatments on NR cells showed co‐localization of mRFP‐GFP (yellow puncta) in all concentrations of DFO and DFP, which indicates the inhibition of autophagy flux. B‐right) The same treatments were performed on TMZ‐resistant cells. Similar to NR cells, autophagy inhibition by DFO and DFP was observed in TMZ‐resistant cells. C) Different variation in autophagic flux was observed in hypoxic non‐resistant and TMZ‐resistant cells. Iron chelators induced autophagy, but regulated the flux, unlike normoxic cells. D) The ratio of LC3II to LC3I quantified by counting red and yellow puncta confirmed the inhibition and regulation of autophagic flux in normoxia and hypoxia, respectively. E) These results were also confirmed by WB. (Note that β‐actin was probed separately and each of the experimental conditions across the lanes came from the same lysate master mix; see further explanation about β‐actin in Immunoblotting section of Experimental Methods). N = 3 biological independent experiments. Scale bars are 20 µm.
Figure 8
Figure 8
Higher expression of bax in DFO‐treated TMZ‐resistant cells, while hypoxia reduces the expression of caspase3. A) Dose dependent induction of cell blebbing was observed in normoxic non‐resistant cells. B) Hypoxia reduced cell blebbing in both non‐resistant and TMZ‐resistant cells. C) Expression of bax and caspase3 in normoxic and hypoxic non‐resistant and TMZ‐resistant cells in response to 10 and 100 mM of DFO and DFP. (Note that β‐actin was probed separately for Caspase 3 and each of the experimental conditions across the lanes came from the same lysate master mix; see further explanation about β‐actin in Immunoblotting section of Experimental Section). Bax expression was increased only in response DFO in normoxic and hypoxic TMZ‐resistant cells. However, bax was not increased in non‐resistant cells under any treatment. Although neither of the chelators showed significant increase in the expression of caspase3, it was reduced in hypoxia. N = 3 biological independent experiments and statistically significant at ***p‐value < 0.001 and ****p‐value < 0.0001. Scale bars are 20 µm.

Similar articles

References

    1. Alifieris C., Trafalis D. T., Pharmacol. Ther. 2015, 152, 63. - PubMed
    1. Ostrom Q. T., Gittleman H., Liao P., Vecchione‐Koval T., Wolinsky Y., Kruchko C., Barnholtz‐Sloan J. S., Neuro Oncol. 2017, 19, v1. - PMC - PubMed
    1. Montemurro N., J. Neurol. Surg. A: Cent. Eur. Neurosurg. 2020, 81, 64. - PubMed
    1. Tan A. C., Ashley D. M., López G. Y., Malinzak M., Friedman H. S., Khasraw M., CA Cancer J. Clin. 2020, 70, 299. - PubMed
    1. Lee S. Y., Genes Dis. 2016, 3, 198. - PMC - PubMed

LinkOut - more resources