. 2025 Mar 27;30(7):1494.
doi: 10.3390/molecules30071494.

Neuropilin Antagonists (NRPas) Block the Phosphorylation of the Cancer Therapeutic Key Factor p38α Kinase Triggering Cell Death

Affiliations

Neuropilin Antagonists (NRPas) Block the Phosphorylation of the Cancer Therapeutic Key Factor p38α Kinase Triggering Cell Death

Lucia Borriello et al. Molecules. .

Abstract

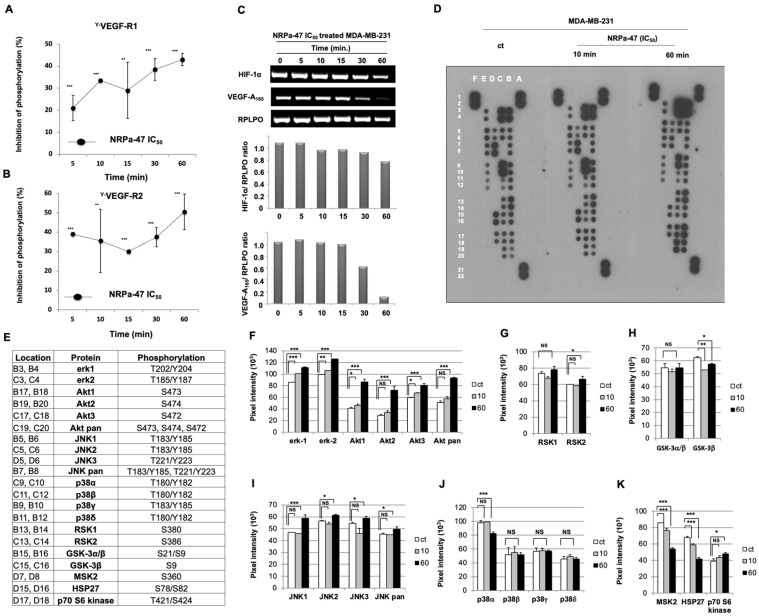
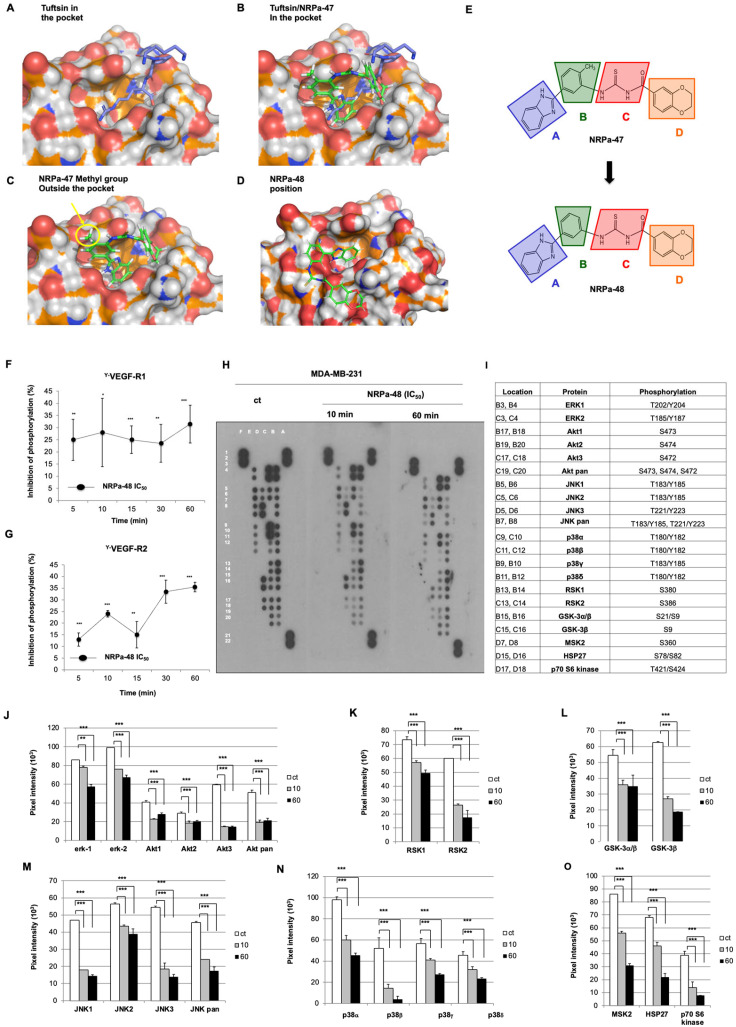
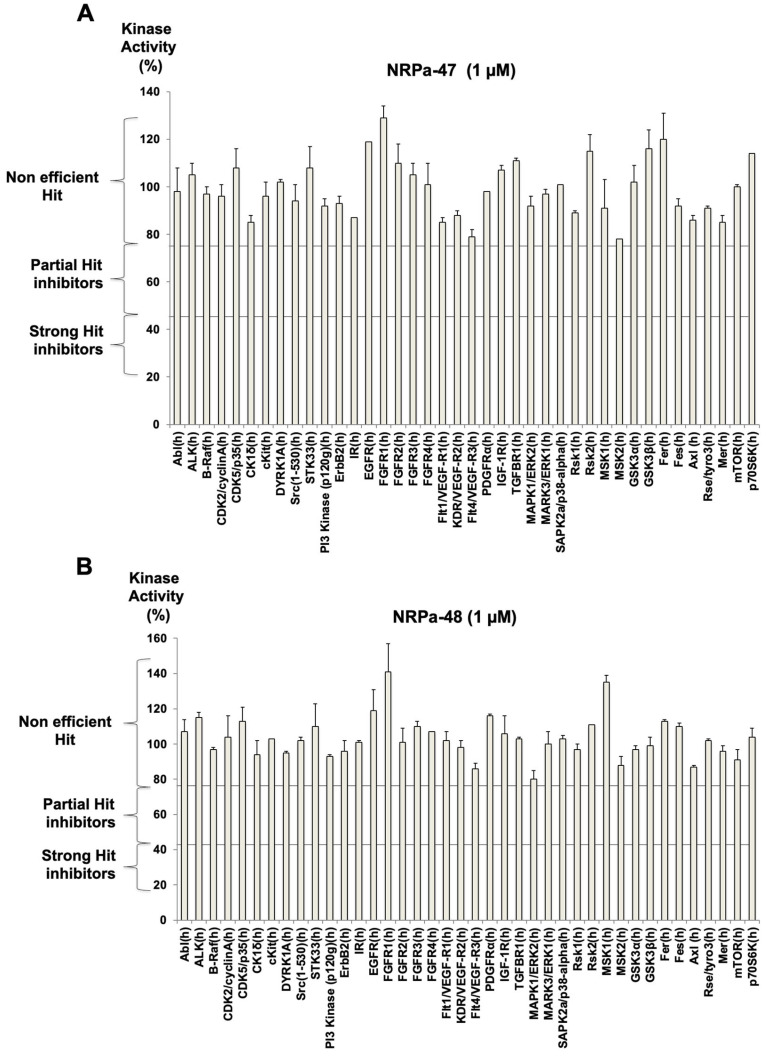
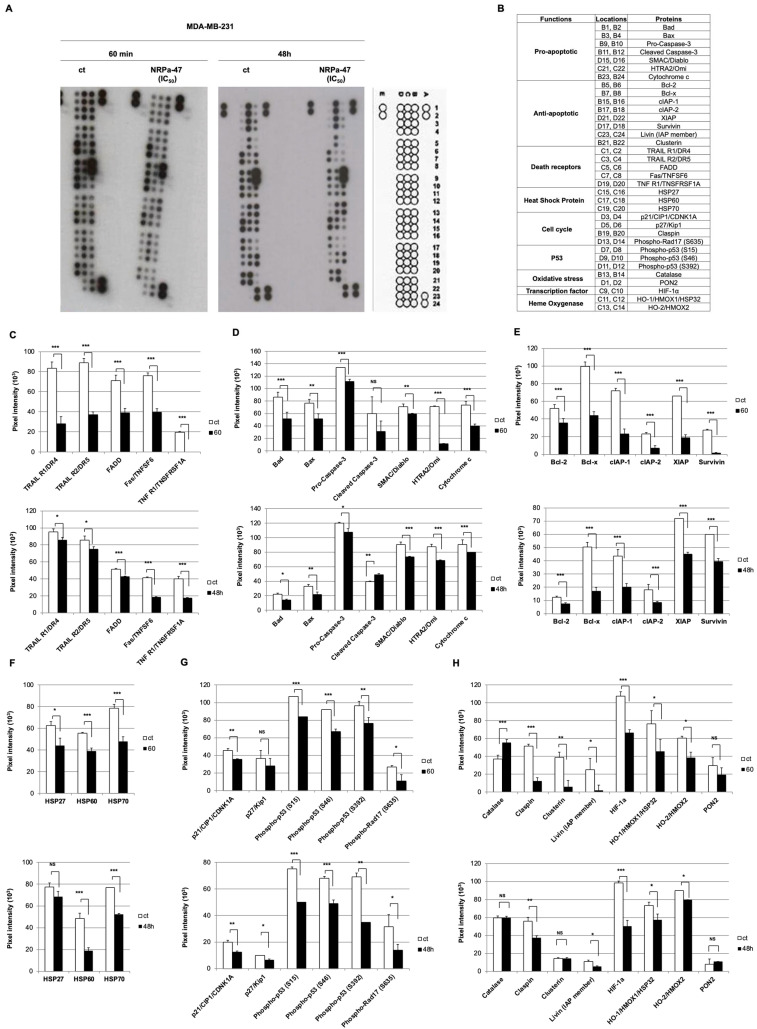
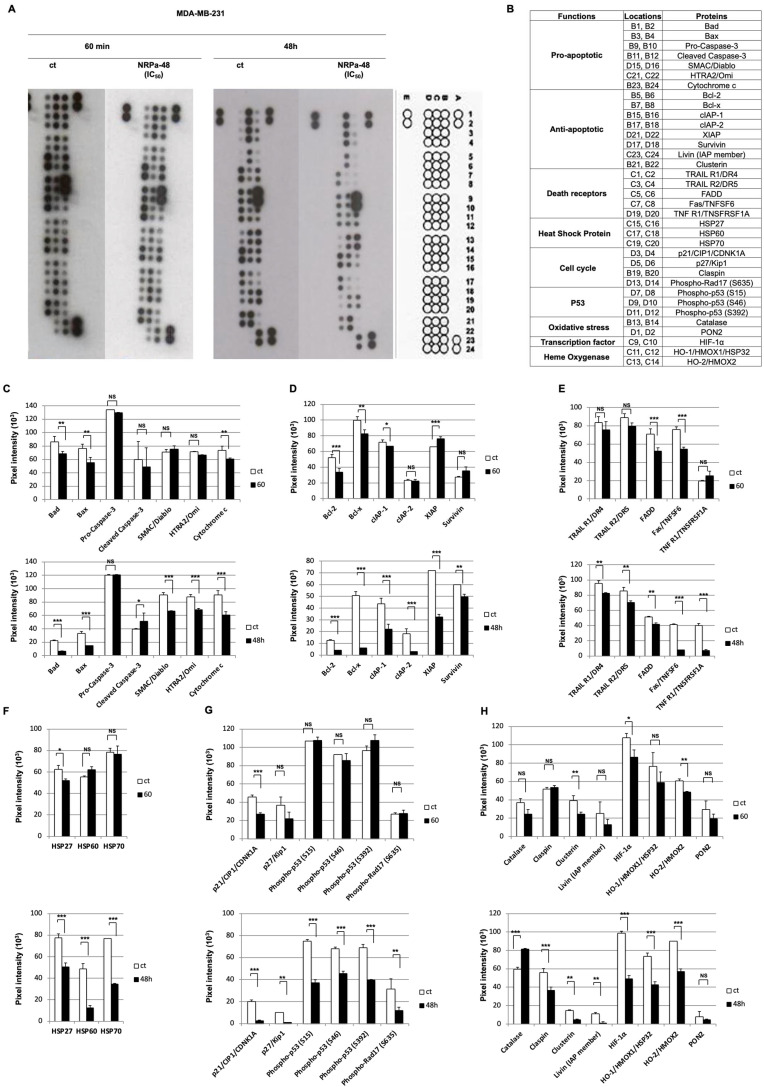
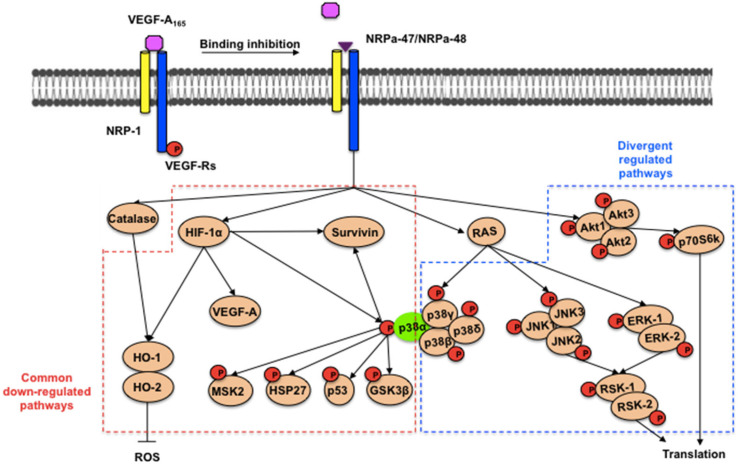
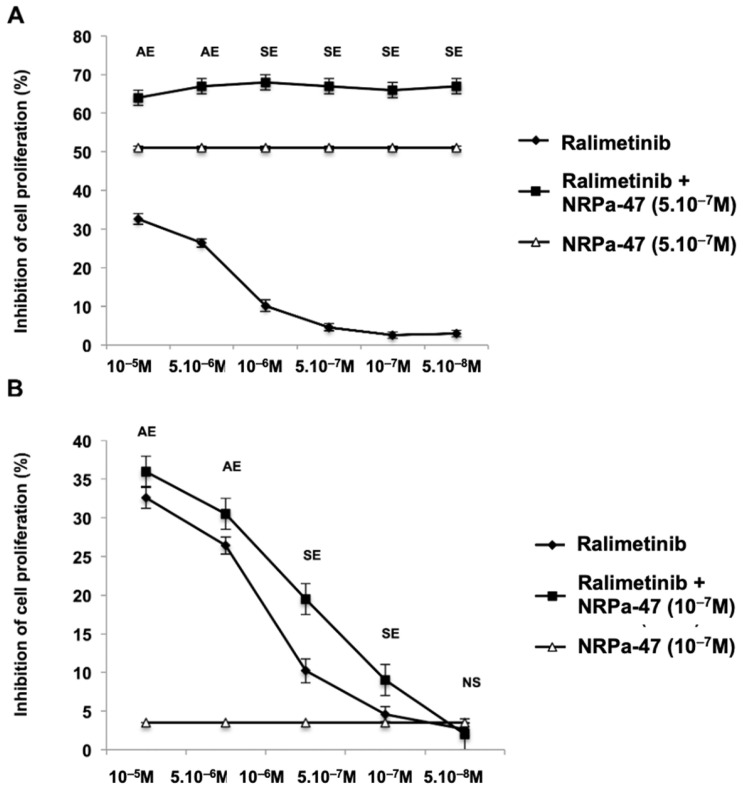
Neuropilin-1 is henceforth a relevant target in cancer treatment; however, its way of action remains partly elusive, and the development of small inhibitory molecules is therefore required for its study. Here, we report that two small-sized neuropilin antagonists (NRPa-47 and NRPa-48), VEGF-A165/NRP-1 binding inhibitors, are able to decrease VEGF-Rs phosphorylation and to modulate their downstream cascades in the triple-negative breast cancer cell line (MDA-MB-231). Nevertheless, NRPas exert a divergent pathway regulation of MAPK phosphorylation, such as JNK-1/-2/-3, ERK-1/-2, and p38β/γ/δ-kinases, as well as their respective downstream targets. However, NRPa-47 and NRPa-48 apply a common down-regulation of the p38α-kinase phosphorylation and their downstream targets, emphasising its central regulating role. More importantly, none of the 40 selected kinases, including SAPK2a/p38α, are affected in vitro by NRPas, strengthening their specificity. Taken together, NRPas induced cell death by the down-modulation of pro-apoptotic and anti-apoptotic proteins, cell death receptors and adaptors, heat shock proteins (HSP-27/-60/-70), cell cycle proteins (p21, p27, phospho-RAD17), and transcription factors (p53, HIF-1α). In conclusion, we showed for the first time how NRPas may alter tumour cell signalling and contribute to the down-modulation of the cancer therapeutic key factor p38α-kinase phosphorylation. Thus, the efficient association of NRPas and p38α-kinase inhibitor strengthened this hypothesis.

Keywords: VEGF; breast cancer; neuropilin antagonists; neuropilin-1; p38α kinase.


Conflict of interest statement

Authors Nicolas Lopez and Yves Lepelletier were employed by the company W-MedPhys. All the authors have read the manuscript, concur with its content, and state that its content has not been submitted elsewhere. The authors declare no competing financial interests and no conflict of interest.

Figures

Figure 1
Figure 1
NRPa-47 induces VEGF downstream signalling modification. (A,B) Total tyrosine VEGF-R1 (Y-VEGF-R1) (A) and VEGF-R2 (Y-VEGF-R2) (B) phosphorylation inhibition induced by NRPa-47 (IC50 = 0.6 µM) on MDA-MB-231 in a time-dependent manner (5 to 60 min) using specific ELISA assays. Curves represent means +/− SD of at least three separate experiments, each performed in triplicate. (C) HIF-1α, VEGF-A165, and RPLPO (housekeeping gene) mRNA expressions were assessed in the presence of NRPa-47 in a time course (5 to 60 min). Histograms represent the ratio of HIF-1α/RPLPO and VEGF-A165/RPLPO obtained after pixel intensity quantification using ImageJ 1.52q software of this representative experiment. (D) ECL developed MAPK protein array film of untreated (control) and NRPa-47-treated (IC50 = 0.6 µM) MDA-MB-231 at short time drug exposure (10 and 60 min). The following positions, A1/A2, A21/A22, and F1/F2, were positive controls; E3/E4, E5/E6, E7/E8, E9/10, and E11/E12 were antibody detection controls; and E13/14 were negative controls (background). Images are representative of at least two independent experiments for each condition. (E) Location map of phosphorylated proteins targeted in the MAPK protein array and their respective tyrosine (Y), serine (S), and threonine (T) phosphorylation positions detected. (FK) Histograms show pixel intensity of untreated (ct, white histograms), NRPa-47-treated MDA-MB-231 at 10 (grey histograms) and 60 min (black histograms) of ERK-1/-2 and AKT-1/-2/-3/-pan (F), RSK-1/-2 (G), GSK-3α/β and GSK-3β (H), JNK-1/-2/-3/-pan (I), p38α/p38β/p38γ/p38δ (J), MSK2/HSP27/p70S6kinase (K) proteins. Histograms represent means ± SD of the previous representative selected experiment analysed using Image-J 1.52q software to quantify pixel intensity. (*, p < 0.05; **, p < 0.01; ***, p < 0.001; NS = not significant).
Figure 2
Figure 2
NRPa-48- and NRPa-47-derived mechanism of action on downstream VEGF signalling. (AD) Tuftsin (A), Tuftsin/NRPa-47 (B), NRPa-47 (C), and NRPa-48 (D) predicting the docking model in the NRP-1 b1-domain. These dockings show the NRPa-47 methyl group localisation outside the pocket and highlight small divergences in the NRPa-47/NRP-1 b-1 domain and NRPa-48/NRP-1 b-1 domain interaction patterns probably induced by the “NRPa-47 magic methyl”. (E) NRPa-47 and NRPa-48 structural representations. Benzimidazole core (A, blue) is connected to a methylbenzene (B, green) linked to a benzodioxane motif (D, orange) through a carboxythiourea spacer (C, red). Methyl is suppressed from the methylbenzene (B) to generate the NRPa-48 compound. (F,G) Total tyrosine VEGF-R1 (Y-VEGF-R1) (F) and VEGF-R2 (Y-VEGF-R2) (G) phosphorylation inhibition induced by NRPa-48 (IC50 = 0.4 µM) on MDA-MB-231 in a time-dependent manner (5 to 60 min) using specific ELISA. Curves represent means +/− SD of at least three separate experiments, each performed in triplicate. (H) ECL developed the MAPK protein array film of untreated (control) and NRPa-48-treated MDA-MB-231 at short-time drug exposure (10 and 60 min). The following positions, A1/A2, A21/A22, and F1/F2, were positive controls; E3/E4, E5/E6, E7/E8, E9/10, and E11/E12 were antibody detection controls; and E13/14 were negative controls (background). Images are representative of at least two independent experiments for each condition. (I) Location map of phosphorylated proteins targeted in the MAPK protein array and their respective tyrosine (Y), serine (S), and threonine (T) phosphorylation positions detected. (JO) Histograms show pixel intensity of untreated (ct, white histograms), NRPa-48-treated (IC50 = 0.4 µM) MDA-MB-231 at 10 (grey histograms) and 60 min (black histograms) of ERK-1/-2 and AKT-1/-2/-3/-pan (J), RSK-1/-2 (K), GSK-3α/β and GSK-3β (L), JNK-1/-2/-3/-pan (M), p38α/p38β/p38γ/p38δ (N), MSK2/HSP27/p70S6kinase (O) proteins. Histograms represent means ± SD of the previous representative selected experiment analysed using Image-J 1.52q software to quantify pixel intensity. (*, p < 0.05; **, p < 0.01; ***, p < 0.001).
Figure 3
Figure 3
NRPa-47 and NRPa-48 protein kinase profiling. Protein kinase profiling of NRPa-47 (A) and NRPa-48 (B) was performed at 1 µM on a selection of 40 kinases, including Neuroplin-1 co-receptors and related biochemical kinase signalling observed during this study.
Figure 4
Figure 4
Apoptosis pathways regulation by NRPa-47. (A) ECL developed an apoptosis protein array film of untreated (control) and NRPa-47-treated MDA-MB-231 at short (10 min) and long (48 h) drug exposure with a position map. The following positions, A1/A2, A23/A24, and E1/F2, were positive controls, and D23/24 were negative controls (background). Images are representative of at least two independent experiments for each condition. (B) Location map of pro-apoptotic, anti-apoptotic, death receptor, heat shock protein, cell cycle, P53 pathway, oxidative stress, transcriptional factor, and heme oxygenase targeted in apoptosis protein array (letters and numbers indicate spot position). (C-H-M) Histograms show pixel intensity of untreated (ct, white histograms), NRPa-47-treated (IC50 = 0.6 µM) MDA-MB-231 at 60 min (grey histograms) and 48 h (black histograms) of pro-apoptotic (Bad, Bax, SMAC/Diablo, HTRA2/Omi, pro-caspase 3, caspase 3, and cytochrome c) (C), anti-apoptotic (Bcl-2, Bcl-x, cIAP-1, cIAP-2, XIAP, Survivin) (D), cell death receptors (TRAIL-R1/DR4, TRAIL-R2/DR5, FAS/TNFSF6, TNF-R1/TNSFRSF1A, FADD (E), heat shock proteins (HSP-27, HSP-60, HSP-70) (F), cell cycle and P53 pathway (G) and anti-apoptotic (Livin, Clusterin), oxidative stress (catalase, PON2), transcription factor (HIF-1α) and heme oxygenase (HO-1/HMOX1/HSP32, HO-2/HMOX2) (H) proteins. Histograms represent means ± SD of the previous representative selected experiment analysed using Image-J 1.52q software to quantify pixel intensity. (*, p < 0.05; **, p < 0.01; ***, p < 0.001; NS = not significant).
Figure 5
Figure 5
Apoptosis pathways regulation by NRPa-48 (IC50 = 0.4 +/− 0.2 µM). (A) ECL developed apoptosis protein array film of untreated (control) and NRPa-48-treated MDA-MB-231 at short (60 min) and long (48 h) time drug exposure with a position map (letters and numbers indicate spot position). The following positions, A1/A2, A23/A24, and E1/F2, were positive controls, and D23/24 were negative controls (background). Images are representative of at least two independent experiments for each condition. (B) Location map of pro-apoptotic, anti-apoptotic, death receptor, heat shock protein, cell cycle, P53 pathway, oxidative stress, transcriptional factor, and heme oxygenase targeted in apoptosis protein array. (C-H-M) Histograms show pixel intensity of untreated (ct, white histograms), NRPa-48-treated (IC50 = 0.4 +/− 0.2 µM) MDA-MB-231 at 60 min (grey histograms) and 48 h (black histograms) of pro-apoptotic (Bad, Bax, SMAC/Diablo, HTRA2/Omi, pro-caspase 3, caspase 3, and cytochrome c) (C), anti-apoptotic (Bcl-2, Bcl-x, cIAP-1, cIAP-2, XIAP, Survivin) (D), cell death receptors (TRAIL-R1/DR4, TRAIL-R2/DR5, FAS/TNFSF6, TNF-R1/TNSFRSF1A, FADD (E), heat shock proteins (HSP-27, HSP-60, HSP-70) (F), cell cycle, and P53 pathway (G) and anti-apoptotic (Livin, Clusterin), oxidative stress (catalase, PON2), transcription factor (HIF-1α), and heme oxygenase (HO-1/HMOX1/HSP32, HO-2/HMOX2) (H) proteins. Histograms represent means ± SD of the previous representative selected experiment analysed using Image-J 1.52q software to quantify pixel intensity. (*, p < 0.05; **, p < 0.01; ***, p < 0.001; NS = not significant).
Figure 6
Figure 6
In vivo efficacy of NRPa-48. (A) NRPa-48 treatment (50 mg/kg) delayed tumour growth compared to control (PBS). Growth curves from MDA-MB-231 tumours in mice treated with NRPa-48 (n = 10) or vehicle (PBS) (n = 10). Tumour size measurement was interrupted when 50% of the animals were dead. (B) NRPa-48 (50 mg/kg) significantly enhances the survival of mice bearing MDA-MB-231 tumours. Kaplan–Meier survival curves (p) were determined using ANOVA (p = 0.008). Data are representative of 3 separate in vivo experiments. (*, p < 0.05; **, p < 0.01).
Figure 7
Figure 7
Schematic proposal of both NRPas mechanisms of action. VEGF-A165 binding to the functional NRP-1/VEGF-Rs complex was inhibited in the presence of neuropilin antagonists (NRPa-47 and NRPa-48). VEGF-Rs Tyr phosphorylation was inhibited by NRPa. Both NRPas exerted high oxidative-induced stress (catalase) and had a common down-regulated pathway (HIF-1α, heme oxygenase HO-1/HMOX1/HSP32 and HO-2/HMOX2 forms, phospho-heat shock protein 27 (HSP-27), VEGF-A165, Survivin, phospho-mitogen- and stress-activated protein kinase 2 (MSK2), phospho-p53, phospho-GSK-3β, and phospho-p38α). Both NRPas also mediated opposite regulating signalling (phospho-AKT, phospho-p70S6k, phospho-JNK-1/-2/-3, phospho-ERK-1/-2, phospho-p38β/γ/δ kinases, and RSK-1/-2.
Figure 8
Figure 8
NRPa/Ralimetinib® association increased anti-breast cancer cell proliferation. A concentration range of Ralimetinib® is tested alone or in association with NRPa IC50 (A) or sub-optimal NRPa IC50 (0.1 µM) (B) on MDA-MB-231 cell proliferation. The NRPa IC50/Ralimetinib® association showed an additive effect (AE) at high Ralimetinib® concentration and a synergistic effect (SE) at low Ralimetinib® concentration (A). Sub-optimal NRPa IC50/Ralimetinib® association showed an additive effect (AE) at high Ralimetinib® concentration and a synergistic effect (SE) at low Ralimetinib® concentration. Data represent means ± SD of 3 separate experiments, each. (NS: Not significant).

Similar articles

References

    1. Pan Q., Chanthery Y., Liang W.C., Stawicki S., Mak J., Rathore N., Tong R.K., Kowalski J., Yee S.F., Pacheco G., et al. Blocking neuropilin-1 function has an additive effect with anti-VEGF to inhibit tumor growth. Cancer Cell. 2007;11:53–67. doi: 10.1016/j.ccr.2006.10.018. - DOI - PubMed
    1. Kolodkin A.L., Levengood D.V., Rowe E.G., Tai Y.T., Giger R.J., Ginty D.D. Neuropilin is a semaphorin III receptor. Cell. 1997;90:753–762. doi: 10.1016/S0092-8674(00)80535-8. - DOI - PubMed
    1. Koch S., Tugues S., Li X., Gualandi L., Claesson-Welsh L. Signal transduction by vascular endothelial growth factor receptors. Biochem. J. 2011;437:169–183. doi: 10.1042/BJ20110301. - DOI - PubMed
    1. Prud’homme G.J., Glinka Y. Neuropilins are multifunctional coreceptors involved in tumor initiation, growth, metastasis and immunity. Oncotarget. 2012;3:921–939. doi: 10.18632/oncotarget.626. - DOI - PMC - PubMed
    1. Wild J.R., Staton C.A., Chapple K., Corfe B.M. Neuropilins: Expression and roles in the epithelium. Int. J. Exp. Pathol. 2012;93:81–103. doi: 10.1111/j.1365-2613.2012.00810.x. - DOI - PMC - PubMed

MeSH terms

Substances

LinkOut - more resources