. 2025 Apr 3;31(2):gaaf015.
doi: 10.1093/molehr/gaaf015.

Roles of chromosomal and gonadal sex in the fetal and placental responses to maternal food restriction in mice

Affiliations

Roles of chromosomal and gonadal sex in the fetal and placental responses to maternal food restriction in mice

Jess C Hercus et al. Mol Hum Reprod. .

Abstract

It is hypothesized that male fetuses are more vulnerable to in utero insults than females due to different growth strategies, and that the placenta contributes to these sex differences. We examined sex differences in the fetal and placental responses to maternal food restriction (∼60% of ad libitum) beginning mid-gestation (Day 11.5). To dissect the roles of chromosomal and gonadal sex, we used the Four Core Genotypes mouse model, which combines deletion of the testis-determining Sry gene from the Y chromosome and autosomal insertion of the Sry gene, such that XX gonadal males and XY gonadal females are produced in addition to XX females and XY males. Food restriction reduced fetal and placental weights but had no effect on the number of viable conceptuses. However, this effect did not differ between gonadal male and female, or between XX and XY, conceptuses. Sex differences in gene expression in both the labyrinth and the combined junctional zone/decidua, as assessed by RNA sequencing, were due entirely to chromosomal sex and not gonadal sex. Food restriction affected the expression of 525 and 665 genes in the labyrinth and the junctional zone/decidua, respectively. However, these effects of food restriction did not differ by gonadal or chromosomal sex when assessed for statistical interactions. In contrast, when analyzing XX and XY placentas separately, hundreds of genes were affected by food restriction in one sex but not in the other, including hundreds of genes not found to be significant in the combined analyses. However, estimated effect sizes were generally similar for XX and XY placentas, suggesting that these sex-stratified analyses greatly exaggerated the extent of sex-dependent responses. Overall, we did not find evidence of the hypothesized sex differences in fetal growth strategy and found that sex differences in placental gene expression were largely due to chromosomal sex.

Keywords: RNA sequencing; decidua; junctional zone; labyrinth; malnutrition; placenta; sex differences; transcriptomics.


Conflict of interest statement

None declared.

Figures

Graphical Abstract
Graphical Abstract
Maternal food restriction in the Four Core Genotypes model; the testis-determining Sry gene is on an autosome and deleted on the Y-chromosome (Y), allowing chromosomal sex to be studied independently of gonadal status.
Figure 1.
Figure 1.
Female weight at mating and through pregnancy in control and food restriction females. Blue symbols: control; Red symbols: food restriction. ***P < 0.0001.
Figure 2.
Figure 2.
Effects of treatment, gonadal sex, chromosomal sex, and mating type (four core genotypes (FCG) or wild type) on fetal traits. Blue symbols: control; Red symbols: food restriction. (A) Anogenital distance (AGD). (B) Fetal weight. (C) Length of the fetal head. (D) Size of the fetal kidney. Plots A and B show average values per dam per genotype and plots C and D show individual fetuses, but all analyses described in text included all individual values and dam as a repeated, random subject. Only P-values for significant terms are shown in the figures; full models are described in the text.
Figure 3.
Figure 3.
Effects of treatment, gonadal sex, chromosomal sex, and mating type (four core genotypes (FCG) or wild type) on placental traits. Blue symbols: control; Red symbols: food restriction. (A) Placental weight. (B) Relationship between placental weight and fetal weight. (C) Area of the junctional zone. (D) Area of the labyrinth. Plot A shows average values per dam per genotype, while plot B shows individual fetuses, but analyses described in text included all individual values and dam as a repeated, random subject. Only P-values for significant terms are shown in the figures; full models are described in the text. Plots C and D present average values per placenta.
Figure 4.
Figure 4.
Effects of food restriction on gene expression in the labyrinth. (A) Heat map of genes differentially expressed. (B) Volcano plot; gene names are provided where the absolute log2-fold change was >2. (C) Principal component (PC) analysis of labyrinth samples, based on the top 500 most variable genes after variance stabilizing transformation (VST) by DESeq2. (D) MA plot; gene names are provided where the absolute log2-fold change was >1 and the log2 mean expression was >7.
Figure 5.
Figure 5.
Effects of food restriction on gene expression in the junctional zone/decidua. (A) Heat map of genes differentially expressed. (B) Volcano plot; gene names are provided where the absolute log2-fold change was >2. (C) Principal component (PC) analysis of junctional zone/decidua, based on the top 500 most variable genes after variance stabilizing transformation (VST) by DESeq2. (D) MA plot; gene names are provided where the absolute log2-fold change was >1 and the log2 mean expression was >8.
Figure 6.
Figure 6.
Functional enrichment analysis of genes affected by food restriction. (A) Genes upregulated and (B) genes downregulated by food restriction in the labyrinth and junctional zone/decidua, including gene ontology (GO) terms for biological processes (BP) and molecular functions (MF), as well as Kyoto Encyclopedia of Genes and Genomes (KEGG) pathways.
Figure 7.
Figure 7.
Overlap in effects of food restriction or chromosomal sex between the labyrinth and junctional zone/decidua. (A) Overlap in genes upregulated by food restriction. (B) Overlap in genes downregulated by food restriction. (C) Overlap in genes upregulated in XY tissues. (D) Overlap in genes downregulated in XY tissues.
Figure 8.
Figure 8.
Effects of chromosomal sex on gene expression in the labyrinth. (A) Heat map of genes differentially expressed. (B) Volcano plot; gene names are provided where the absolute log2-fold change was >2.
Figure 9.
Figure 9.
Effects of chromosomal sex on gene expression in the junctional zone/decidua. (A) Heat map of genes differentially expressed. (B) Volcano plot; gene names are provided where the absolute log2-fold change was >2.
Figure 10.
Figure 10.
Expression levels of the steroid hormone receptors. Normalized counts of androgen receptor (Ar), estrogen receptor 1 (alpha) (Esr1), estrogen receptor 2 (beta) (Esr2), G protein-coupled estrogen receptor 1 (Gper1), and glucocorticoid receptor (Nr3c1) in the labyrinth and junctional zone/decidua.
Figure 11.
Figure 11.
Consistency of effects of treatment and chromosomal sex in the labyrinth when four core genotypes (FCG) and wild-type samples were analyzed separately. (A) Effects of treatment. (B) Effects of chromosomal sex. Only genes showing significant differential expression in the combined analysis are included. Symbol color indicates whether effect was significant in both FCG and wild-type sub-analyses (yellow), significant in wild type but not FCG (blue), significant in FCG but not wild type (red), or not significant in either of the sub-analyses, but significant in the combined analysis (black). Gene names are provided where the absolute log2-fold change in the combined analysis was >1.5.
Figure 12.
Figure 12.
Consistency of effects of treatment and chromosomal sex in the junctional zone/decidua when four core genotypes (FCG) and wild-type samples were analyzed separately. (A) Effects of treatment. (B) Effects of chromosomal sex. Only genes showing significant differential expression in the combined analysis are included. Symbol color indicates whether effect was significant in both FCG and wild-type sub-analyses (yellow), significant in wild type but not FCG (blue), significant in FCG but not wild type (red), or not significant in either of the sub-analyses, but significant in the combined analysis (black). Gene names are provided where the absolute log2-fold change in the combined analysis was >1.5.
Figure 13.
Figure 13.
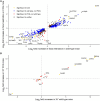
Effects of treatment on placental gene expression from analyses stratified by chromosomal sex, including both four core genotypes (FCG) and wild-type samples. (A) Venn diagram of the overlap in genes significantly affected by treatment (food restriction vs control) in the labyrinth in separate analyses for each chromosomal sex and in the combined analysis including both XX and XY. (B) Overlap in genes significantly affected by treatment in the junctional zone/decidua. (C) Distribution of the difference in estimated effect of treatment (log2-fold change) in the labyrinth between XX and XY placentas among genes significant in XX but not XY placentas (above, blue), and vice versa (below, red). (D) Distribution of the difference in estimated effect of treatment between the chromosomal sexes in the junctional zone/decidua.

Similar articles

References

    1. Al-Qaraghouli M, Fang YMV. Effect of fetal sex on maternal and obstetric outcomes. Front Pediatr 2017;5:144. - PMC - PubMed
    1. Arnold AP. Four Core Genotypes and XY mouse models: update on impact on SABV research. Neurosci Biobehav Rev 2020;119:1–8. - PMC - PubMed
    1. Bale TL. The placenta and neurodevelopment: sex differences in prenatal vulnerability. Dialogues Clin Neurosci 2016;18:459–464. - PMC - PubMed
    1. Bellott DW, Hughes JF, Skaletsky H, Brown LG, Pyntikova T, Cho T-J, Koutseva N, Zaghlul S, Graves T, Rock S et al. Mammalian Y chromosomes retain widely expressed dosage-sensitive regulators. Nature 2014;508:494–499. - PMC - PubMed
    1. Bidne KL, Rister AL, McCain AR, Hitt BD, Dodds ED, Wood JR. Maternal obesity alters placental lysophosphatidylcholines, lipid storage, and the expression of genes associated with lipid metabolism‡. Biol Reprod 2021;104:197–210. - PMC - PubMed

Substances

LinkOut - more resources