. 2025 Jun 11;5(6):100854.
doi: 10.1016/j.xgen.2025.100854. Epub 2025 Apr 25.

Effects of parental autoimmune diseases on type 1 diabetes in offspring can be partially explained by HLA and non-HLA polymorphisms

Affiliations

Effects of parental autoimmune diseases on type 1 diabetes in offspring can be partially explained by HLA and non-HLA polymorphisms

Feiyi Wang et al. Cell Genom. .

Abstract

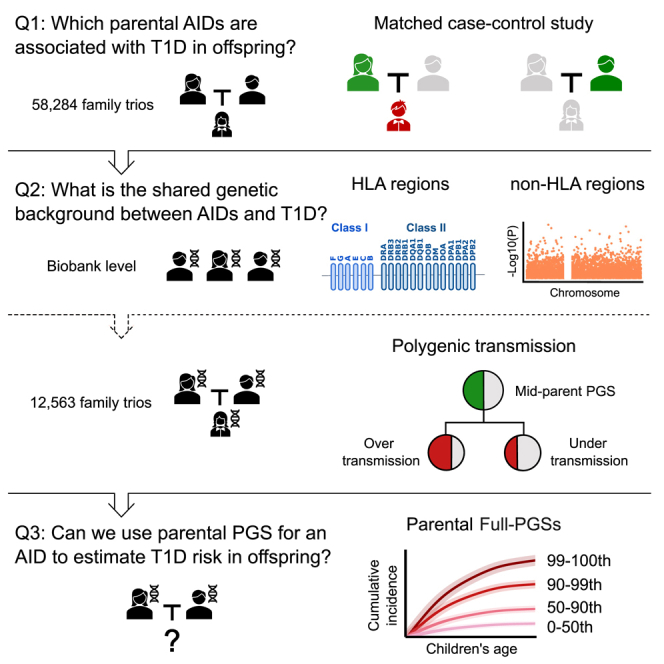
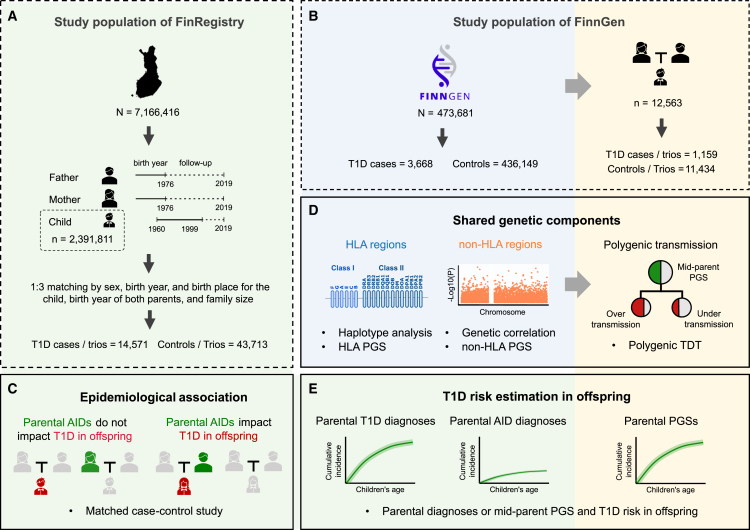
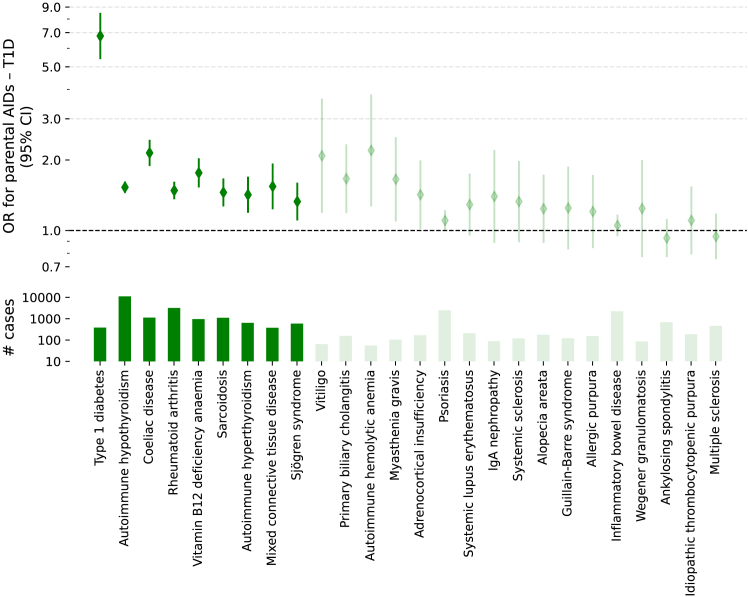
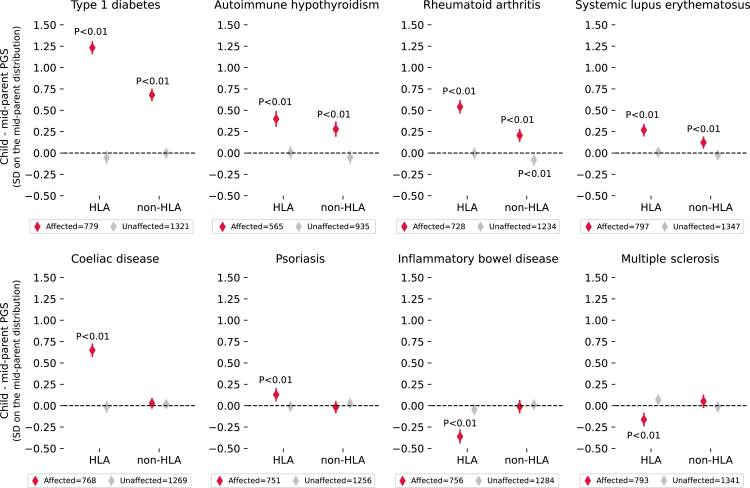
Type 1 diabetes (T1D) and other autoimmune diseases (AIDs) often co-occur in families. Leveraging data from 58,284 family trios in Finnish nationwide registers (FinRegistry), we identified that, of 50 parental AIDs examined, 15 were associated with an increased T1D risk in offspring. These identified epidemiological associations were further assessed in 470,000 genotyped Finns from the FinnGen study through comprehensive genetic analyses, partitioned into human leukocyte antigen (HLA) and non-HLA variations. Using FinnGen's 12,563 trios, a within-family polygenic transmission analysis demonstrated that the aggregation of many parental AIDs with offspring T1D can be partially explained by HLA and non-HLA polymorphisms in a disease-dependent manner. We therefore proposed a parental polygenic score (PGS), incorporating both HLA and non-HLA polymorphisms, to characterize the cumulative risk pattern of T1D in offspring. This raises an intriguing possibility of using parental PGS, in conjunction with clinical diagnoses, to inform individuals about T1D risk in their offspring.

Keywords: HLA; autoimmune disease; celiac disease; family history; genetic correlation; major histocompatibility complex; multi-trait PRS; polygenic risk score; polygenic transmission disequilibrium test; rheumatoid arthritis; type 1 diabetes.


Conflict of interest statement

Declaration of interests A.G. is the founder of Real World Genetics. R.O. holds a UK Medical Research Council Institutional Confidence in Concept grant to develop a 10 SNP biochip T1D genetic test in collaboration with Randox.

Figures

None
Graphical abstract
Figure 1
Figure 1
An overview of the study design and study populations (A) The study population of FinRegistry (7.2 million individuals) represents every Finn alive in 2010 (5.3 million individuals) and their first-degree relatives. To maximize the coverage of diagnoses of AIDs for parents and T1D for children, we included only family trios with both parents born before 1976 and children between 1960 and 1999 (the follow-up time in 2019 was at least 45 years for parents and 20 years for children). The solid lines denote the birth year range of the study population, and the dashed lines are the years of follow-up. Among the 2.4 million family trios, 14,571 had a child ever diagnosed with T1D (T1D trio). For each T1D trio, we matched three control trios based on sex, birth year, birthplace, and the number of siblings of the child as well as the birth year of both parents. In total, we included 14,571 T1D trios and 43,713 matched control trios. (B) FinnGen comprises 473,700 Finns enrolled through a nationwide network of biobanks. We studied 3,370 T1D cases, 385,786 controls, as well as 12,563 family trios constructed with genomic information (1,129 T1D trios and 11,434 control trios). (C) A matched case-control study was conducted among the 58,284 FinRegistry family trios to examine the association between parents’ AID and offspring’s T1D. The different symbols denote father, mother, and offspring and color the disease status (red, offspring with T1D; green, parents with AIDs; gray, individuals unaffected by T1D or other AIDs). (D) Shared genetic components between T1D and other AIDs were examined using population-based analyses (on the left with a blue background) or trio-based family analyses (on the right with a yellow background). A haplotype and PGS-based analysis of HLA variants was conducted in 473,700 FinnGen participants (left), a genetic correlation analysis of the non-HLA variants utilized GWAS summary statistic data (center), and a polygenic transmission disequilibrium test (pTDT) examined in FinnGen participants whether the AID-associated common variants as a whole were overtransmitted from AID-unaffected parents to their T1D-affected offspring (right). (E) The average AID PGS of the parents and its predictive performance of T1D in offspring among 12,563 genotyped family trios in FinnGen.
Figure 2
Figure 2
Epidemiological associations between parental AIDs and T1D in offspring ordered by p value Top: association (OR and 95% CI) between parental AIDs and T1D in offspring using a matched case-control design in Finnish nationwide registry data (FinRegistry). Bottom: number of T1D cases with parents having a given AID diagnosis. The dark green diamonds and bars indicate AIDs that are significantly associated with T1D in offspring after multiple testing corrections.
Figure 3
Figure 3
Shared genetic background between T1D and other AIDs, stratified by HLA and non-HLA variations at the population level (A) Top: association (OR and 95% CI) between HLA PGSs for different AIDs and T1D in FinnGen. The dark blue squares indicate that the HLA PGS for a given disease has a significant association with T1D after multiple testing corrections. × denotes that an HLA PGS could not be robustly constructed for that AID (STAR Methods). Bottom: blue bars represent the number of individuals with the given disease. (B) Top: non-HLA-based genetic correlations (rg and 95% CI) between AIDs and T1D using GWAS summary statistics from European populations. Bottom: the number of cases for the given disease. The dark orange squares or bars indicate that the AIDs have a significant rg with T1D after multiple testing corrections.
Figure 4
Figure 4
pTDTs assess whether the transmission of AID PGSs to offspring significantly deviated from the mid-parent PGS among T1D-affected offspring and the unaffected siblings Deviations from mid-parent PGS (mean and 95% CI) of 1 SD change in offspring PGS are present, separately for HLA and non-HLA regions. The p value is obtained from a two-sided t test and shown as p < 0.01 for significant results; otherwise, it is not marked. Red color denotes offspring with T1D and gray unaffected siblings.
Figure 5
Figure 5
Cumulative risk of offspring T1D by parental AID PRS and disease status Adjusted survival curves with 95% CI from Cox proportional hazards models for cumulative T1D incidence by age 20 in offspring, stratified by parental full T1D PGS percentiles comprising both HLA and non-HLA variants (A–C, 8,872 FinnGen genotyped trios), parents’ T1D status (D–F, 3,048,812 FinRegistry trios), parents’ other AIDs (G–I, 3,037,723 FinRegistry trios after removing trios having parent(s) diagnosed with T1D), including T1D, HYPO, RA, SLE, CD, psoriasis, IBD, and MS. Shown are pooled data for both sexes (left), daughters (center), and sons (right).

Similar articles

Cited by

References

    1. Chiou J., Geusz R.J., Okino M.-L., Han J.Y., Miller M., Melton R., Beebe E., Benaglio P., Huang S., Korgaonkar K., et al. Interpreting type 1 diabetes risk with genetics and single-cell epigenomics. Nature. 2021;594:398–402. - PMC - PubMed
    1. Kavvoura F.K., Ioannidis J.P.A. CTLA-4 Gene Polymorphisms and Susceptibility to Type 1 Diabetes Mellitus: A HuGE Review and Meta-Analysis. Am. J. Epidemiol. 2005;162:3–16. - PubMed
    1. Knip M., Veijola R., Virtanen S.M., Hyöty H., Vaarala O., Åkerblom H.K. Environmental Triggers and Determinants of Type 1 Diabetes. Diabetes. 2005;54:S125–S136. - PubMed
    1. Gregory G.A., Robinson T.I.G., Linklater S.E., Wang F., Colagiuri S., De Beaufort C., Donaghue K.C., Magliano D.J., Maniam J., Orchard T.J., et al. Global incidence, prevalence, and mortality of type 1 diabetes in 2021 with projection to 2040: a modelling study. Lancet Diabetes Endocrinol. 2022;10:741–760. - PubMed
    1. Hormazábal-Aguayo I., Ezzatvar Y., Huerta-Uribe N., Ramírez-Vélez R., Izquierdo M., García-Hermoso A. Incidence of type 1 diabetes mellitus in children and adolescents under 20 years of age across 55 countries from 2000 to 2022: A systematic review with meta-analysis. Diabetes Metabolism Res. 2024;40 - PubMed