. 2025 Apr 26;16(1):346.
doi: 10.1038/s41419-025-07615-y.

MMP1-induced NF-κB activation promotes epithelial-mesenchymal transition and sacituzumab govitecan resistance in hormone receptor-positive breast cancer

Affiliations

MMP1-induced NF-κB activation promotes epithelial-mesenchymal transition and sacituzumab govitecan resistance in hormone receptor-positive breast cancer

Letian Chen et al. Cell Death Dis. .

Abstract

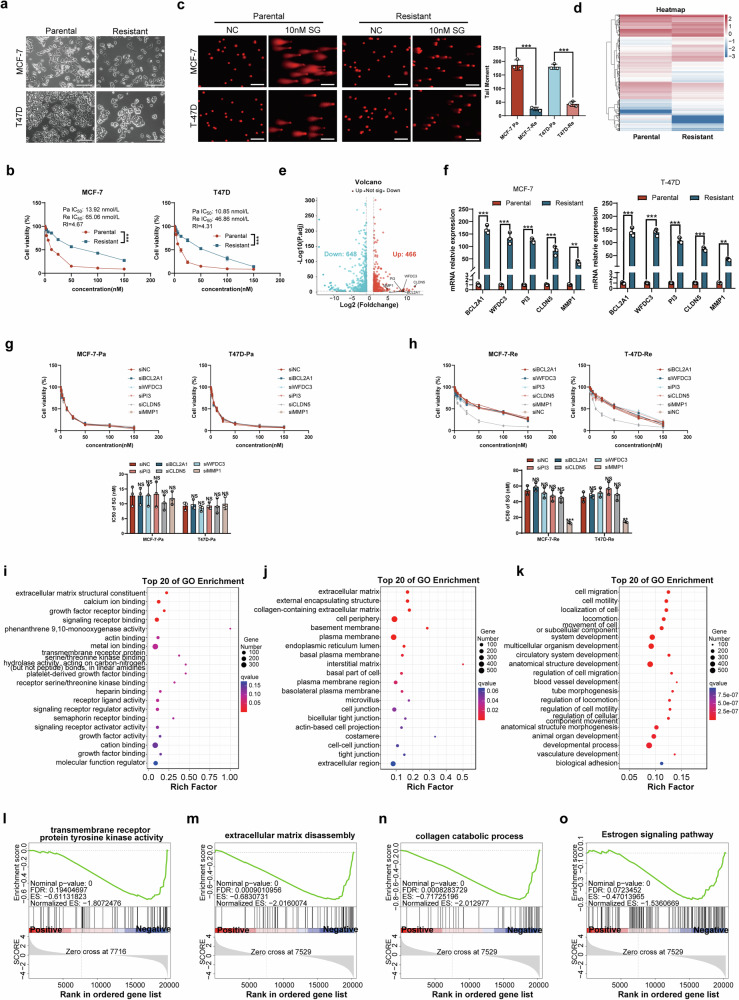
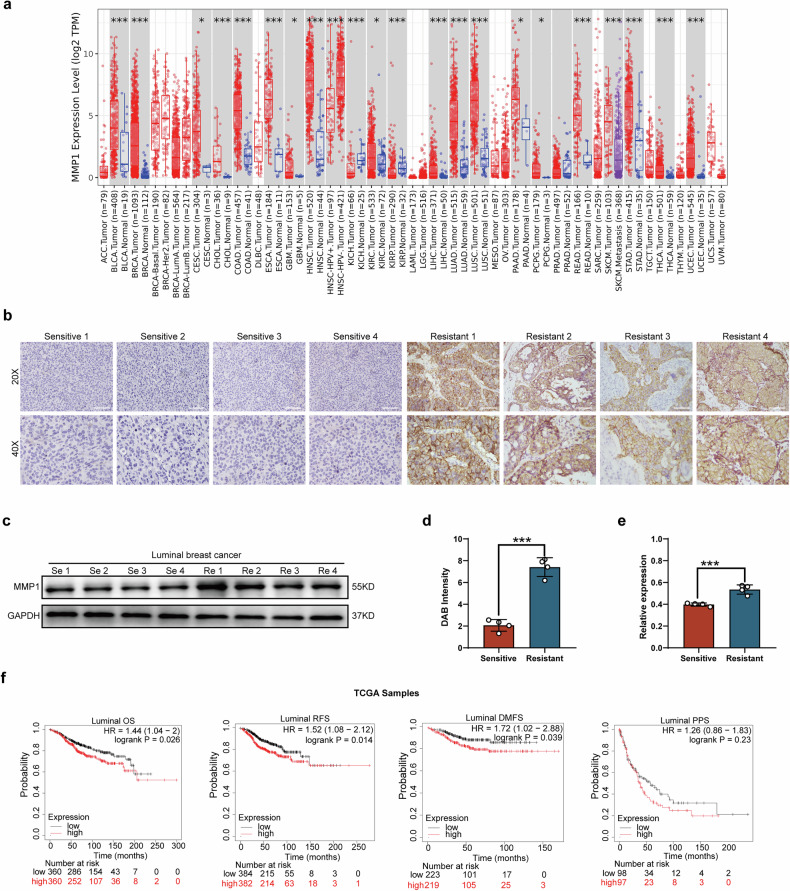
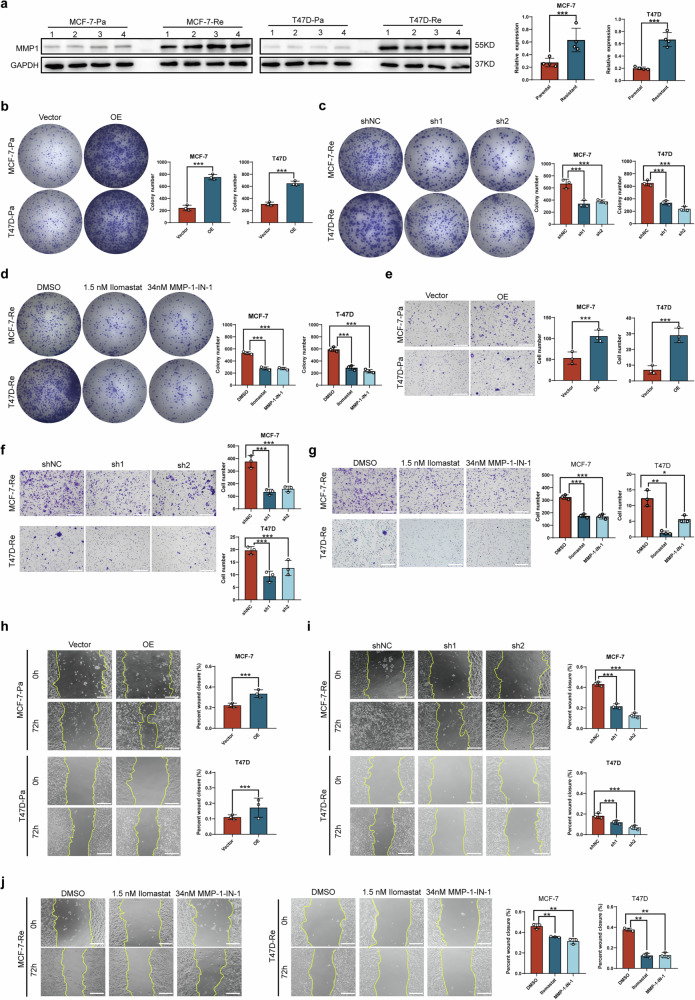
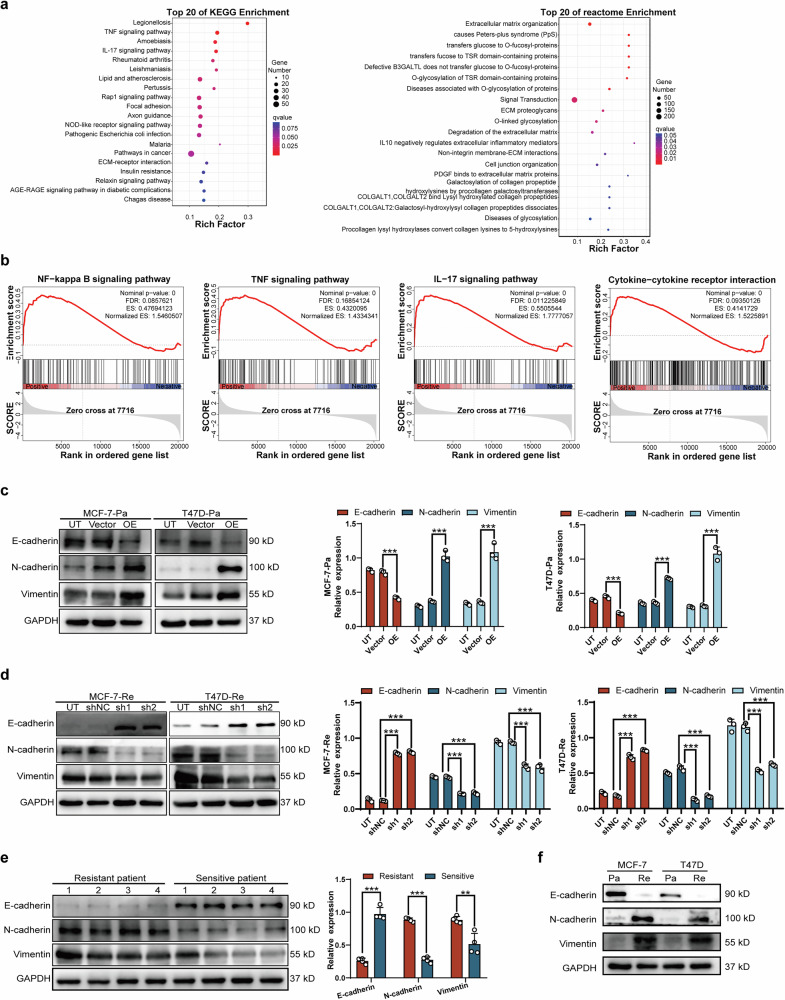
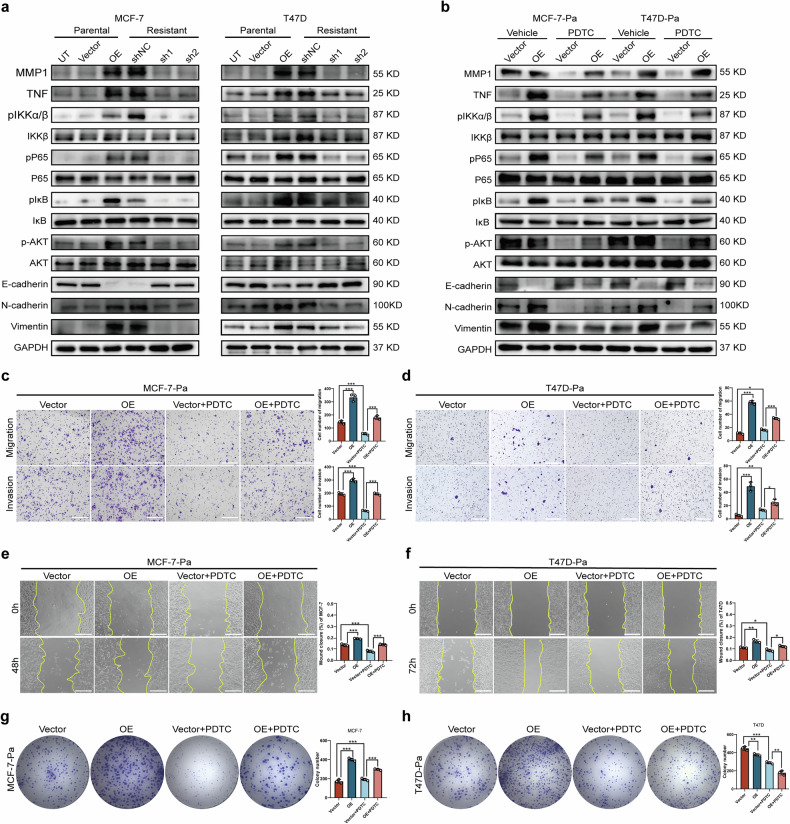
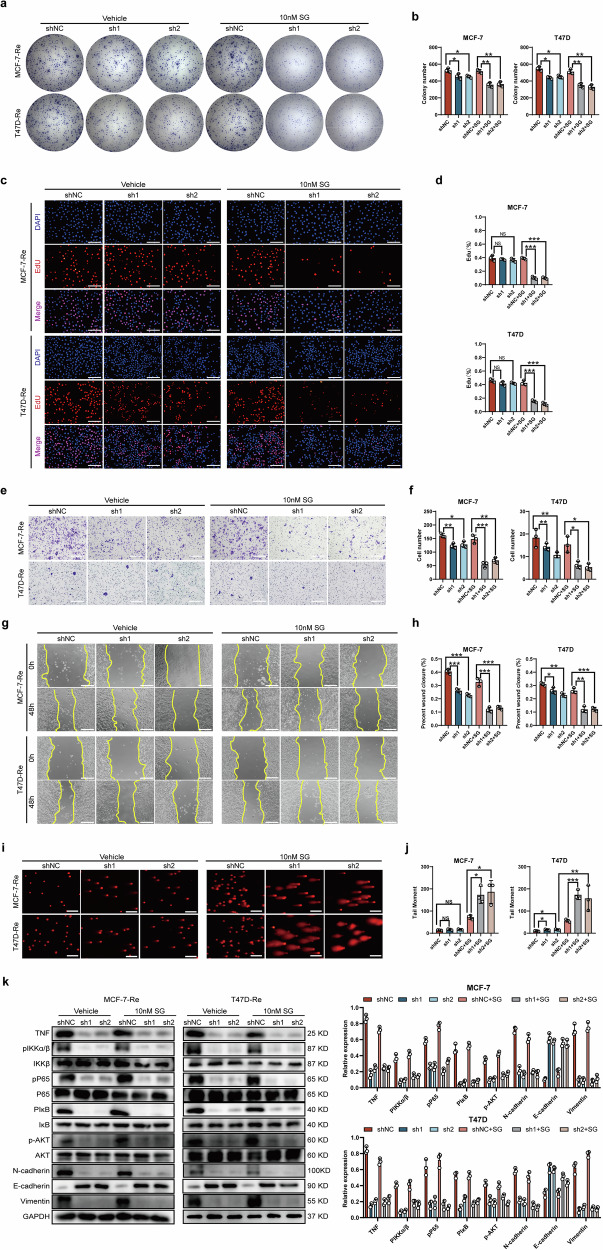
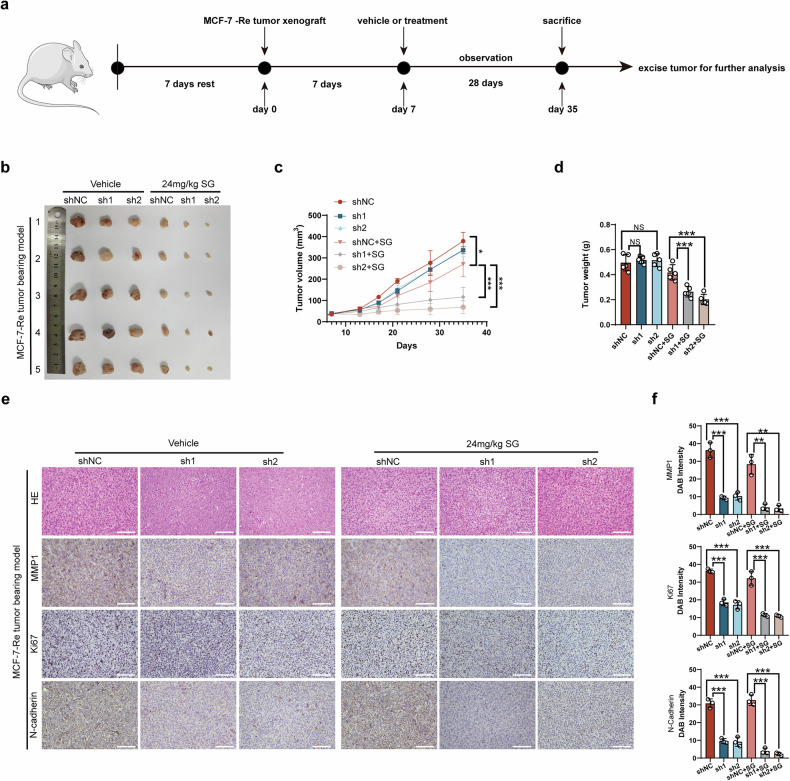
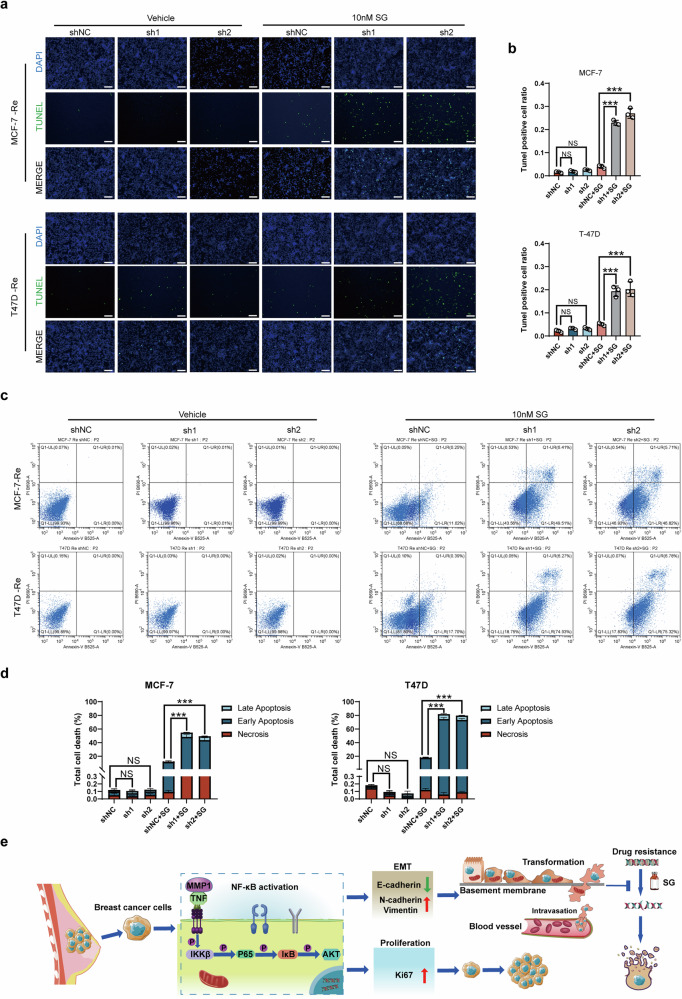
Sacituzumab govitecan (SG), a novel antibody-drug conjugate (ADC), shows promise in the treatment of breast cancer (BC); however, drug resistance limits its clinical application. Matrix metalloproteinase 1 (MMP1), which is overexpressed in many tumor types, plays a key role in tumor metastasis and drug resistance. The involvement of MMP1 in SG resistance in metastatic hormone receptor-positive (HR + ) BC has not been previously reported. In this study, we employed various in vitro and in vivo approaches to investigate the role of MMP1 in SG resistance in BC. MMP1 expression was manipulated in different BC cell lines through lentiviral transfection and small interfering RNA techniques. Key methodologies included Western blot, quantitative reverse transcription PCR, and RNA sequencing to assess marker expression and identify differentially expressed genes. Functional assays were conducted to evaluate cell viability, proliferation, invasion, and migration. In vivo, a cell-derived xenograft model in nude mice was utilized to assess tumor growth and drug response. Bioinformatics analyses further explored MMP1 expression and its clinical relevance across different cancer types. Our findings indicate that MMP1 is overexpressed by approximately 30-fold in HR + BC tissues and is associated with poorer prognosis among HR + BC patients. Furthermore, our analysis reveals that HR + BC with high MMP1 expression displays resistance to SG, supporting the hypothesis that MMP1 plays a key role in regulating ADC resistance. Mechanistic studies demonstrate that MMP1 can activate the NF-κB pathway, which subsequently influences the epithelial-mesenchymal transition, thereby contributing to SG resistance. Ultimately, our research underscores the potential of MMP1 as a therapeutic target and biomarker, facilitating personalized treatment strategies that could enhance patient outcomes in BC therapy.


Conflict of interest statement

Competing interests: The authors declare that the research was conducted in the absence of any commercial or financial relationships that could be construed as a potential conflict of interest. Ethical approval: This study was conducted in accordance with the ethical principles outlined in the Declaration of Helsinki. Written informed consent was obtained from all participants or their legal guardians prior to sample collection and data acquisition. The animal study was reviewed and approved by the Ethics Committee of the Experimental Animal Ethics Committee of Sun Yat-sen University.

Figures

Fig. 1
Fig. 1. MMP1 as an ECM-related gene associated with SG resistance in BC cells.
a Cell morphology was observed under a microscope (Scale bar: 100 µm). b Cell viability was assessed after 24 h of treatment with 10 nM SG at various concentrations using the CCK-8 assay. c Representative fluorescence images and quantification of tail moment in parental and resistant cells. d The heatmap displays gene expression in the resistant group compared to the parental group in MCF-7 cells. The colors of the heatmap reflect log2 expression levels of genes. e Volcano plots illustrate differential gene expressions in MCF-7-Re compared to MCF-7-Pa cells. Red dots indicate genes with significantly higher expression levels, while green dots represent lower expression levels. f qRT-PCR verified expressions of BCL2A1, WFDC3, PI3, CLDN5, and MMP1 between parental and resistant cells. g After knockdown of BCL2A1, WFDC3, PI3, CLDN5, and MMP1 separately, the viability of MCF-7-Pa and T47D-Pa was tested at different concentrations of SG using CCK-8 assays. h After knockdown of BCL2A1, WFDC3, PI3, CLDN5, and MMP1 separately, the viability of MCF-7-Re and T47D-Re was tested at different concentrations of SG using CCK-8 assays. IC50 values for all groups were calculated using GraphPad and compared using Student’s t-test. ik GO enrichment analysis was performed on genes involved in biological processes, cellular components, and molecular functions. lo Enrichment of cancer biomarkers based on DEGs between resistant cells and parental cells using GSEA.
Fig. 2
Fig. 2. High expression of MMP1 in HR + BC tissues and its association with poor prognosis.
a MMP1 expression is significantly higher in malignant tissues compared to normal tissues across various cancer types. The TIMER 2.0 database shows that MMP1 is significantly overexpressed in 20 types of malignancies relative to normal tissues. Statistical significance is indicated by asterisks. b MMP1 expression levels in SG-resistant and SG-sensitive groups were assessed by IHC using clinical samples from BC patients. c Protein levels of MMP1 in clinical samples from SG-resistant and SG-sensitive patients were analyzed by Western blot. d Quantitative analysis of panel b is presented in histogram form. e Quantitative analysis of panel c is presented in histogram form. f Survival analysis of patients with high or low expression of MMP1 in the TCGA database (* p < 0.05, ** p < 0.01, *** p < 0.001).
Fig. 3
Fig. 3. Role of high MMP1 expression in enhancing migration, invasion, and proliferation of HR + BC cells.
a MMP1 protein expression levels in parental and resistant cells were measured by Western blot analysis. GAPDH served as an internal control. b Cell proliferation assessed via colony formation assay following MMP1 overexpression in parental cells. c, d Cell proliferation assessed via colony formation assay following MMP1 knockdown and inhibition in resistant cells. e Cell invasion assessed via transwell assays following MMP1 overexpression in parental cells. f, g Cell invasion assessed via transwell assays following MMP1 knockdown and inhibition in resistant cells. h Cell migration assessed via wound scratch assay following MMP1 overexpression in parental cells. I, j Cell migration assessed via wound scratch assay following MMP1 knockdown and inhibition in resistant cells (Scale bar: 100 µm). Data are from three independent experiments. p-values were determined using a two-tailed unpaired Student’s t-test. * p < 0.05, ** p < 0.01, *** p < 0.001.
Fig. 4
Fig. 4. MMP1-induced EMT and proliferation via NF-κB pathway activation in BC cells.
a KEGG pathway and reactome enrichment analyses of the DEGs, highlighting the top 20 related pathways expressed in MCF-7-Re and T47D-Re cells. b Transcriptome data analyzed using GSEA indicated that MMP1 expression levels were positively correlated with metastasis and the NF-κB, TNF, IL-17, and cytokine-cytokine receptor interaction signaling pathways. c MCF-7-Pa and T47D-Pa cells were transfected with an empty vector or MMP1 for 48 h, and the expression of related EMT proteins (N-cadherin, E-cadherin, and vimentin) was measured by Western blot. d SG-resistant BC cells were transfected with MMP1 shRNA and the corresponding control shRNA for 48 h, and the expression levels of different EMT proteins (N-cadherin, E-cadherin, and vimentin) were measured by Western blot. e, f The samples of patients and cell lines of resistant to SG and sensitive to SG were obtained, and the expression levels of different EMT proteins (N-cadherin, E-cadherin, and vimentin) were measured by Western blot. GAPDH served as an internal control. Corresponding quantitative data for N-cadherin, E-cadherin, and vimentin are shown. Data are from three independent experiments. UT untreated. * p < 0.05, ** p < 0.01, *** p < 0.001.
Fig. 5
Fig. 5. MMP1 promotes EMT and proliferation by activating NF-κB pathway in BC cells.
a Effects of MMP1 overexpression and knockdown in parental and resistant cell lines on the NF-κB pathway and EMT markers. MMP1, TNF, pIKKα/β, IKKβ, pP65, P65, pIκB, IκB, AKT, p-AKT, and EMT-related protein markers were detected by Western blot. b MCF-7-Pa and T47D-Pa cells were transfected with a vector or MMP1, followed by treatment with the NF-κB inhibitor PDTC for 24 h. The expression levels of TNF, MMP1, pIKKα/β, IKKβ, pP65, P65, pIκB, IκB, AKT, p-AKT, and EMT-related protein markers were assessed via Western blot. GAPDH served as an internal control. c, d Transwell assays were conducted respectively in MCF-7-Pa and T-47D-Pa cells transduced with a vector or MMP1 to evaluate the effects of MMP1 or the NF-κB inhibitor PDTC on cell migration and invasion. e, f Wound scratch assays were performed respectively in MCF-7-Pa and T-47D-Pa cells transduced with a vector or MMP1 to assess the effects of MMP1 or the NF-κB inhibitor PDTC on cell migration. g, h Colony formation assays were utilized respectively to detect differences in proliferation ability under MMP1 overexpression with or without PDTC treatment in MCF-7-Pa and T-47D-Pa. UT, untreated. * p < 0.05, ** p < 0.01, *** p < 0.001.
Fig. 6
Fig. 6. MMP1 inhibition enhances SG sensitivity in SG-resistant BC cells in vitro.
a, b Representative images and corresponding quantitative analysis of colony formation assays from MCF-7-Re and T47D-Re cells treated with MMP1 shRNA or its control for 48 h, followed by treatment with 10 nM SG for 24 h. c, d Representative images and corresponding quantitative analysis of EdU assays from MCF-7-Re and T47D-Re cells treated with MMP1 shRNA or its control for 48 h, followed by treatment with 10 nM SG for 24 h. e, f Representative images and corresponding quantitative analysis of transwell assays from MCF-7-Re and T47D-Re cells treated with MMP1 shRNA or its control for 48 h, followed by treatment with 10 nM SG for 24 h. g, h Representative images and corresponding quantitative analysis of wound scratch assays from MCF-7-Re and T47D-Re cells treated with MMP1 shRNA or its control for 48 h, followed by treatment with 10 nM SG for 24 h. i, j Representative fluorescence images and quantification of tail moments in MCF-7-Re and T47D-Re cells treated with MMP1 shRNA or its control for 48 h, followed by treatment with 10 nM SG for 24 h. k Representative images and corresponding quantitative analysis of expression of NF-κB pathway and EMT markers from MCF-7-Re and T47D-Re cells treated with MMP1 shRNA or its control for 48 h, followed by treatment with 10 nM SG for 24 h. * p < 0.05, ** p < 0.01, *** p < 0.001.
Fig. 7
Fig. 7. MMP1 inhibition enhances SG sensitivity in SG-resistant BC cells in vivo.
a Flowchart illustrating the construction of the CDX model with MCF-7 used in this study. b Images of harvested tumors from different groups on Day 35. c Tumor volume measurements taken every 7 days across different treatment groups (n = 5 per group). d Tumor weight quantification across different treatment groups (n = 5 per group). e MMP1 inhibition was significantly associated with decreased expression of Ki67 and N-cadherin, with representative images of different tumors shown in IHC results. f Positive rates of Ki67 and N-cadherin. Scale bar: 100 µm. p-values were determined using one-way ANOVA. * p < 0.05, ** p < 0.01, *** p < 0.001.
Fig. 8
Fig. 8. MMP1 inhibition enhances SG-induced cell death.
a, b Comparison of apoptotic cell number between MMP1-knockdown and negative control with or without SG treatment in resistant cell lines via Tunnel assays. c, d Comparison of apoptotic cell number between MMP1-knockdown and negative control with or without SG treatment in resistant cell lines via Annexin V-PI assays. e Proposed mechanisms of MMP1-mediated SG resistance in HR + BC.

Similar articles

References

    1. Giaquinto AN, Sung H, Miller KD, Kramer JL, Newman LA, Minihan A, et al. Breast cancer statistics, 2022. CA Cancer J Clin. 2022;72:524–41. - PubMed
    1. Gennari A, Andre F, Barrios CH, Cortes J, de Azambuja E, DeMichele A, et al. ESMO Clinical Practice Guideline for the diagnosis, staging and treatment of patients with metastatic breast cancer. Ann Oncol. 2021;32:1475–95. - PubMed
    1. Huang J, Zheng L, Sun Z, Li J. CDK4/6 inhibitor resistance mechanisms and treatment strategies (Review). Int J Mol Med. 2022;50:128. - PMC - PubMed
    1. Yuan P, Hu X, Sun T, Li W, Zhang Q, Cui S, et al. Eribulin mesilate versus vinorelbine in women with locally recurrent or metastatic breast cancer: a randomised clinical trial. Eur J Cancer. 2019;112:57–65. - PubMed
    1. Saha T, Lukong KE. Breast cancer stem-like cells in drug resistance: a review of mechanisms and novel therapeutic strategies to overcome drug resistance. Front Oncol. 2022;12:856974. - PMC - PubMed

MeSH terms

LinkOut - more resources