. 2025 Apr 26;11(1):96.
doi: 10.1038/s41531-025-00964-7.

Parkinson's disease is characterized by vitamin B6-dependent inflammatory kynurenine pathway dysfunction

Affiliations

Parkinson's disease is characterized by vitamin B6-dependent inflammatory kynurenine pathway dysfunction

Edward N Wilson et al. NPJ Parkinsons Dis. .

Abstract

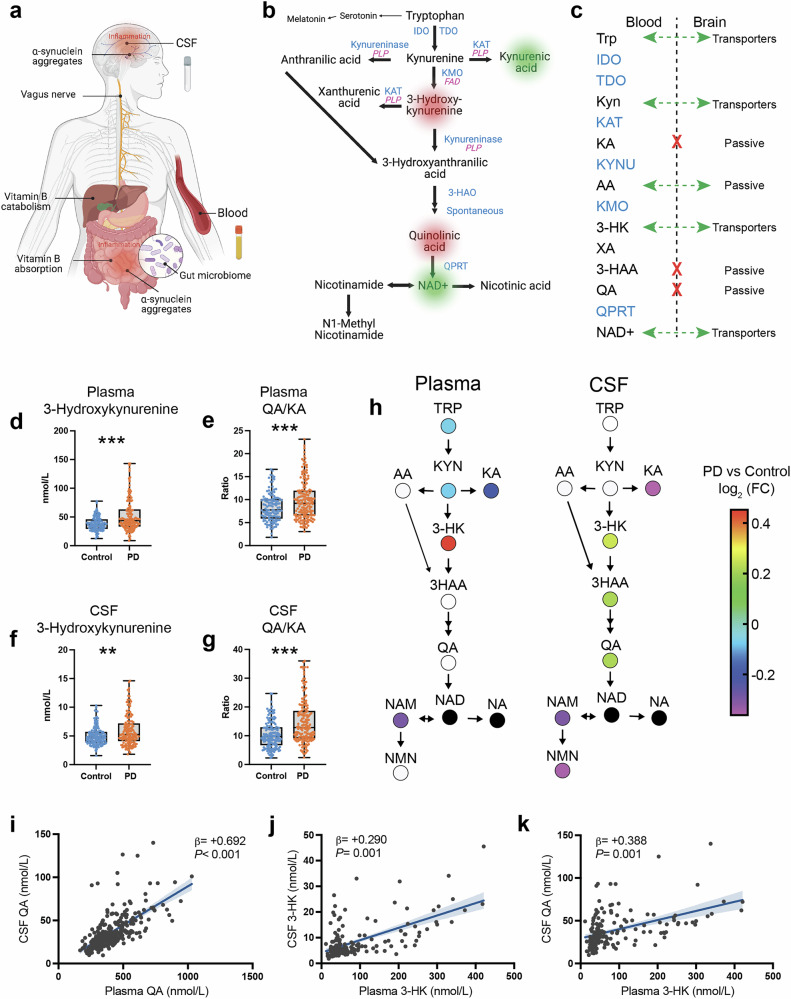
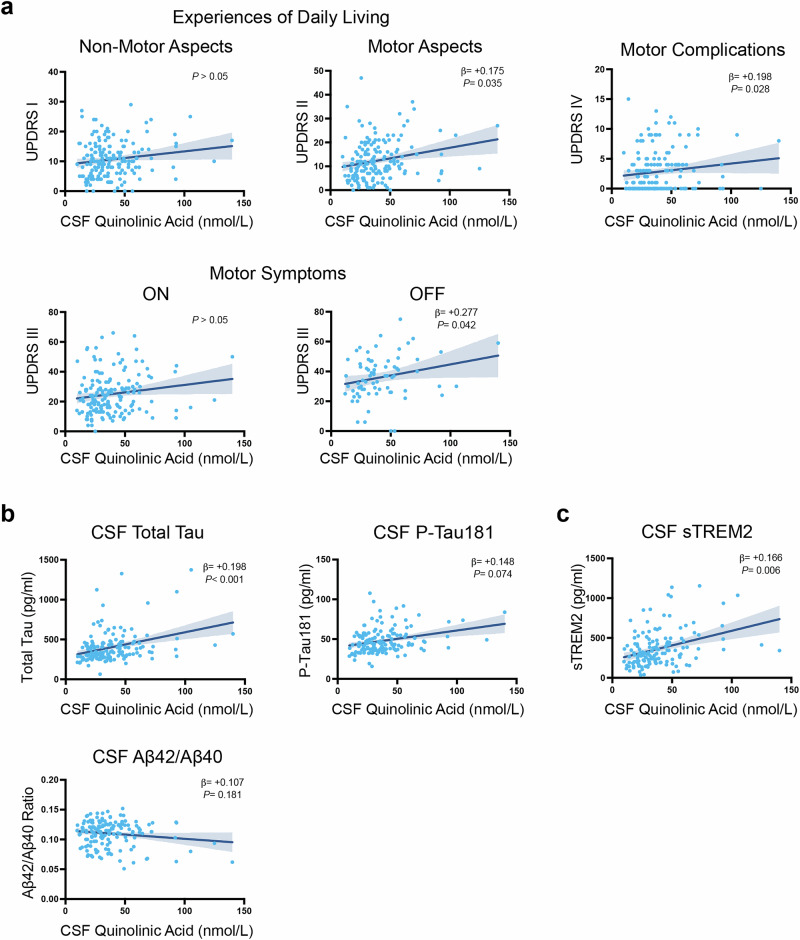
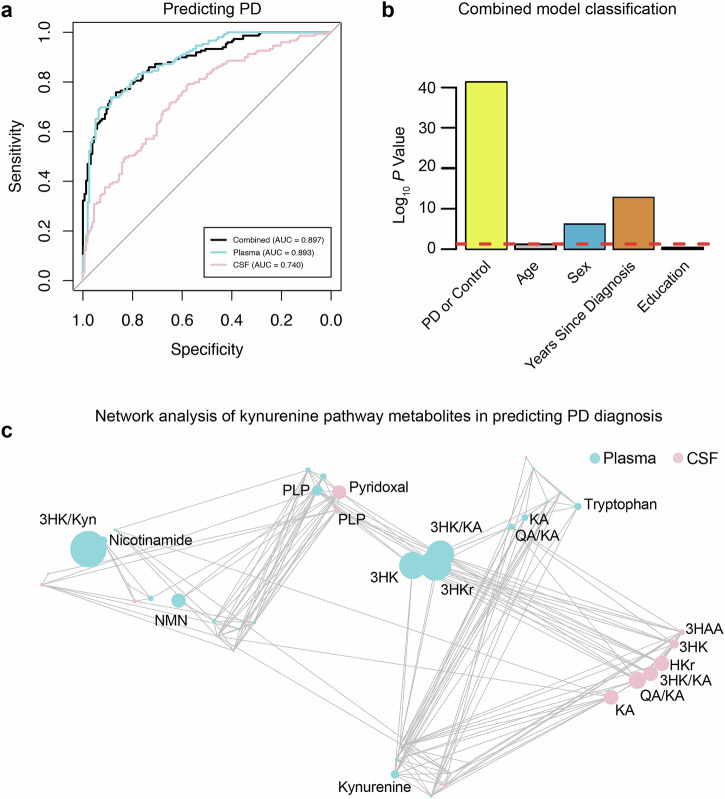
Recent studies demonstrate that Parkinson's disease (PD) is associated with dysregulated metabolic flux through the kynurenine pathway (KP), in which tryptophan is converted to kynurenine (KYN), and KYN is subsequently metabolized to neuroactive compounds quinolinic acid (QA) and kynurenic acid (KA). Here, we used mass-spectrometry to compare blood and cerebral spinal fluid (CSF) KP metabolites between 158 unimpaired older adults and 177 participants with PD. We found increased neuroexcitatory QA/KA ratio in both plasma and CSF of PD participants associated with peripheral and cerebral inflammation and vitamin B6 deficiency. Furthermore, increased QA tracked with CSF tau, CSF soluble TREM2 (sTREM2) and severity of both motor and non-motor PD clinical symptoms. Finally, PD patient subgroups with distinct KP profiles displayed distinct PD clinical features. These data validate the KP as a site of brain and periphery crosstalk, integrating B-vitamin status, inflammation and metabolism to ultimately influence PD clinical manifestation.


Conflict of interest statement

Competing interests: The authors declare no competing interests.

Figures

Fig. 1
Fig. 1. The kynurenine pathway integrates peripheral and CNS proinflammatory responses and metabolic dysfunction in Parkinson’s disease.
a Parkinson’s disease is a multisystem neurodegenerative disease. Recent data support that peripheral α-synuclein pathology and inflammation are related to the gut microbiome and that misfolded α-synuclein may undergo transneuronal transport via the vagus nerve to the brain. b In the kynurenine pathway, tryptophan is metabolized via IDO and TDO to kynurenine, which is converted to either 3-hydroxykynurenine by KMO, to anthranilic acid by kynureninase, or to kynurenic acid by KAT. 3-hydroxykynurenine is converted to xanthurenic acid by KAT. Kynureninase converts 3-hydroxykynurenine and anthranilic acid to 3-hydroxyanthranlic acid. 3-Hydroxyanthranilic acid is converted by 3-HAO, and further spontaneously converts to quinolinic acid, which is converted by QPRT to NAD+, a major energy source for cells. NAD+ is further converted to nicotinamide and N1-methylnicotinamide or to nicotinic acid and then to the antioxidant trigonelline. Tryptophan is also a precursor for serotonin and melatonin production. Key converting enzymes are indicated in blue. Also shown are enzymes supported by the active form of vitamin B6, PLP and B2 vitamer, FAD, in purple). IDO indoleamine 2,3-dioxygenase, 3-HAO 3-hydroxyanthranilate-3,4-dioxygnase, FAD flavin adenine dinucleotide, KAT kynurenine aminotransferase, KMO kynurenine 3-monooxygenase, PLP pyridoxal 5’-phosphate, QPRT quinolinic acid phosphoribosyltransferase, TDO tryptophan 2,3-dioxygenease. c Several kynurenine pathway metabolites (black) have high blood-brain barrier permeability (green arrows), while others are considered to cross the blood-brain barrier poorly (red X). Enzymes are shown in blue and do not cross the blood-brain barrier. High blood-brain permeability would allow passage of circulating kynurenines into brain kynurenine pools. d Box and whisker plot showing median concentration of plasma 3-hydroxykynurenine in control and PD participants. Whiskers indicate minimum to maximum data range. ***P < 0.001 analyzed by ANCOVA with age and sex included as covariates. e Ratio of plasma QA/KA in control and PD participants. ***P < 0.001 analyzed by ANCOVA with age and sex included as covariates. f Concentration of CSF 3-hydroxykynurenine in control and PD participants. **P < 0.01 analyzed by ANCOVA with age and sex included as covariates. g CSF QA/KA in control and PD participants. ***P < 0.001 analyzed by ANCOVA with age and sex as covariates. h Metabolic pathway maps showing plasma (left) and CSF (right) kynurenine pathway metabolites. Metabolites are colored by the log2 fold-change scale comparing the PD group to the control group. Metabolites that were not measured are shown as black circles. FC fold change. i Linear regression of plasma QA predicting CSF QA. Age and sex were included as covariates in the linear model. Shown are the β-estimates and P-values from the linear model and the 95% confidence band of the line of best fit. j Linear regression of plasma 3-HK predicting CSF 3-HK. Age and sex were included as covariates in the linear model. Shown are the β-estimates and P-values from the linear model and the 95% confidence band of the line of best fit. k Linear regression of plasma 3-HK predicting CSF QA. Age and sex were included as covariates in the linear model. Shown are the β-estimates and P-values from the linear model and the 95% confidence band of the line of best fit.
Fig. 2
Fig. 2. Vitamin B6 deficiency associates with inflammation and neuroexcitatory KP activation in PD.
a Kynurenine pathway enzymes (blue) require B-vitamin cofactors (green) for their activity. 3-HK: 3-hydroxykynurenine, FAD flavine adenine dinucleotide, KAT kynurenine aminotransferase, KMO kynurenine 3-monooxygenase, KYNU kynureninase, PLP pyridoxal 5’phosphate. b B-vitamins, HKr, and the PAr Index in plasma from control and PD participants. HKr is a validated functional measure of vitamin B6 status. PAr is an index of vitamin B6 catabolism. ***P < 0.001 using ANCOVA including age and sex as covariates. HKr HK ratio. c B-vitamins and HKr in CSF from control and PD participants. HKr is a validated functional measure of vitamin B6 status. **P < 0.01, ***P < 0.001 using ANCOVA including age and sex as covariates. HKr HK ratio. d Plasma neopterin, a validated marker of inflammation, in control and PD participants. ***P < 0.001 using ANCOVA including age and sex as covariates. e Linear regression reveals that plasma PAr is significantly correlated with plasma neopterin concentration. Age and sex were included as covariates in the linear model. Shown are the β-estimates and P-values from the linear model and the 95% confidence band of the line of best fit. PAr PAr Index. f Correlation matrix showing association between plasma metabolites (black text) and B-vitamins (blue text) in PD participants. Age and sex were included as covariates. Significant correlations are shown with the circle size indicating the P-value of the correlation and color indicating size and direction of the β-estimate. 3-HK 3-hydroxykynurenine, HKr HK ratio, Kyn kynurenine, PAr PAr Index, QA quinolinic acid. g Correlation matrix showing association between CSF metabolites (black text) and B-vitamins (blue text) in PD participants. Age and sex were included as covariates. Significant correlations are shown with the circle size indicating the P-value of the correlation and color indicating size and direction of the β-estimate. 3-HK 3-hydroxykynurenine, HKr HK ratio, Kyn kynurenine, QA quinolinic acid.
Fig. 3
Fig. 3. CSF QA associates with motor symptoms and tau in Parkinson’s disease.
a Linear regression analysis showing associations between CSF QA with MDS-UPDRS Parts I-IV scores in PD participants. Plotted is the 95% confidence band of the best-fit line from the linear regression. Age and sex were included as covariates. β-estimates and P-values from the linear model are shown. MDS-UPDRS Movement Disorder Society Unified Parkinson’s Disease Rating Scale, QA quinolinic acid. b Linear regression analysis showing associations between CSF QA and core AD biomarkers CSF total tau, p-tau181, and Aβ42/Aβ40 ratio in PD participants. Plotted is the 95% confidence band of the best-fit line from the linear regression. CSF biomarkers were log-transformed in a linear model that included age and sex as covariates. β-estimates and P-values from the linear model are shown. c Linear regression analysis showing associations between CSF QA and biomarker of microglial activation CSF sTREM2 in PD participants. Plotted is the 95% confidence band of the best-fit line from the linear regression. CSF biomarkers were log-transformed in a linear model that included age and sex as covariates. β-estimates and P-values from the linear model are shown.
Fig. 4
Fig. 4. PD prediction using plasma and CSF KP metabolites and related B-vitamins.
a ROC curve analysis of a combined model consisting of plasma and CSF KP-related metabolites and their ratios (black curve), and single fluid models with plasma (cyan curve) or CSF (salmon curve) in distinguishing PD participants (n = 149) from control participants (n = 158). All metabolite biomarkers were used in these models. A cross-validation strategy was employed such that half the participants were used to optimize the integrated model, after which the remaining half were presented to the model to test its performance. b Combined model performance in correctly classifying diagnosis, age, sex, years since diagnosis and education. c Network analysis revealing kynurenine pathway metabolites correlating with predicting PD vs control (Spearman correlation P < 0.05). Metabolites are coded according to sample type (plasma: cyan or CSF: salmon). Circle size indicates degree of association between metabolite and predicting PD diagnosis. KA kynurenic acid, 3-HK 3-hydroxykynurenine, 3HAA 3-hydroxyanthranilic acid, QA quinolinic acid, NMN N1-methylnicotinamide.
Fig. 5
Fig. 5. Parkinson’s disease metabolic subgroups show distinct clinical endophenotypes.
a Schematic depicting study participant subgrouping by KP metabolite data. b Kynurenine pathway metabolite and B-vitamin markers of the PD clinical subgroups. Increased KP metabolites marking the Dystonia Subgroup included plasma 3-HK, CSF HKr, CSF 3-HK/KA and CSF QA/KA. The Rigid Subgroup was marked by lower levels of plasma KYN. The Vitamin B1 Subgroup was marked by high plasma thiamine levels found to be in the range of vitamin supplementation. Group differences were assessed using one-way ANOVA with Tukey’s post hoc test for pairwise comparisons. ***P < 0.001 and ****P < 0.0001. c Clinical features associating with each of the PD clinical subgroups. The Dystonia Subgroup had higher MDS-UPDRS scores on Dystonia and Impact of Fluctuations compared to the other subgroups. In addition, the Dystonia Subgroup had higher scores for Anxiety, Depression, Insomnia, and Pain. Conversely, the Rigidity Subgroup had lower scores across these domains but did have higher Rigidity LUE and Body Bradykinesia. Group differences were assessed using one-way ANOVA with Tukey’s post hoc test for pairwise comparisons. *P < 0.05. Abbreviations: LUE: left upper extremity.

Update of

References

    1. Poewe, W. et al. Parkinson disease. Nat. Rev. Dis. Prim.3, 17013 (2017). - PubMed
    1. Lawton, M. et al. Parkinson’s Disease Subtypes in the Oxford Parkinson Disease Centre (OPDC) Discovery Cohort. J. Parkinsons Dis.5, 269–279 (2015). - PMC - PubMed
    1. Chen-Plotkin, A. S. et al. Finding useful biomarkers for Parkinson’s disease. Sci. Transl. Med.10, 10.1126/scitranslmed.aam6003 (2018). - PMC - PubMed
    1. Tan, E. K. et al. Parkinson disease and the immune system - associations, mechanisms and therapeutics. Nat. Rev. Neurol.16, 303–318 (2020). - PubMed
    1. Harms, A. S., Yang, Y. T. & Tansey, M. G. Central and peripheral innate and adaptive immunity in Parkinson’s disease. Sci. Transl. Med15, eadk3225 (2023). - PubMed

Grants and funding

LinkOut - more resources