

Genetic determinants of proteomic aging
- PMID: 40287427
- PMCID: PMC12033249
- DOI: 10.1038/s41514-025-00205-4
Genetic determinants of proteomic aging
Abstract
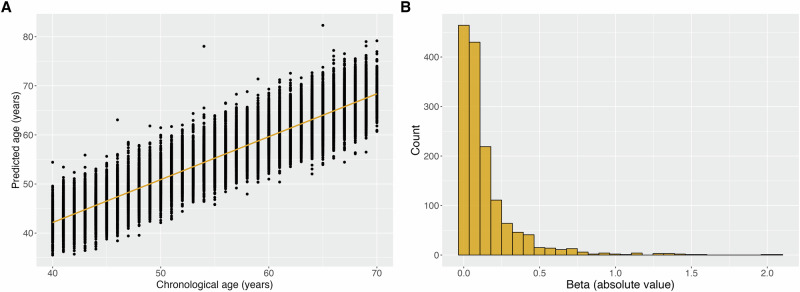
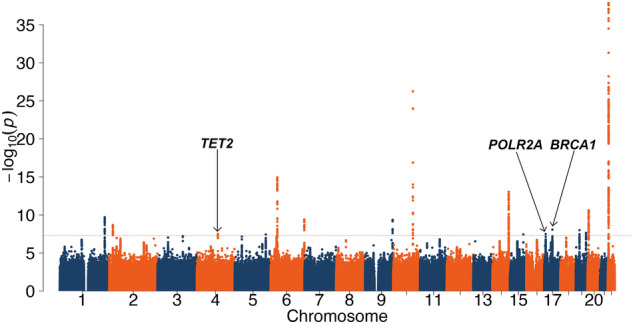
Changes in the proteome and its dysregulation have long been known to be a hallmark of aging. We derived a proteomic aging trait using data on 1459 plasma proteins from 44,435 UK Biobank individuals measured using an antibody-based assay. This metric is strongly associated with four age-related disease outcomes, even after adjusting for chronological age. Survival analysis showed that one-year older proteomic age, relative to chronological age, increases all-cause mortality hazard by 13 percent. We performed a genome-wide association analysis of proteomic age acceleration (proteomic aging trait minus chronological age) to identify its biological determinants. Proteomic age acceleration showed modest genetic correlations with four epigenetic clocks (Rg = 0.17 to 0.19) and telomere length (Rg = -0.2). Once we removed associations that were explained by a single pQTL, we were left with three signals mapping to BRCA1, POLR2A and TET2 with apparent widespread effects on plasma proteomic aging. Genetic variation at these three loci has been shown to affect other omics-related aging measures. Mendelian randomisation analyses showed causal effects of higher BMI and type 2 diabetes on faster proteomic age acceleration. This supports the idea that obesity and other features of metabolic syndrome have an adverse effect on the processes of human aging.
© 2025. The Author(s).
Conflict of interest statement
Competing interests: J.R.B.P. is an employee/shareholder of Insmed. J.R.B.P. also receives research funding from GSK. Y.Z. is a UK University worker at GSK.
Figures

Similar articles
-
Associations of four biological age markers with child development: A multi-omic analysis in the European HELIX cohort.Elife. 2023 Jun 6;12:e85104. doi: 10.7554/eLife.85104. Elife. 2023. PMID: 37278618 Free PMC article.
-
Proteomic Mendelian randomization to identify protein biomarkers of telomere length.Sci Rep. 2024 Sep 16;14(1):21594. doi: 10.1038/s41598-024-72281-7. Sci Rep. 2024. PMID: 39284832 Free PMC article.
-
Causal association of obesity with epigenetic aging and telomere length: a bidirectional mendelian randomization study.Lipids Health Dis. 2024 Mar 12;23(1):78. doi: 10.1186/s12944-024-02042-y. Lipids Health Dis. 2024. PMID: 38475782 Free PMC article.
-
Causal association of epigenetic aging and COVID-19 severity and susceptibility: A bidirectional Mendelian randomization study.Front Med (Lausanne). 2022 Sep 23;9:989950. doi: 10.3389/fmed.2022.989950. eCollection 2022. Front Med (Lausanne). 2022. PMID: 36213637 Free PMC article. Review.
-
Epigenetic Clocks: In Aging-Related and Complex Diseases.Cytogenet Genome Res. 2023;163(5-6):247-256. doi: 10.1159/000534561. Epub 2023 Oct 28. Cytogenet Genome Res. 2023. PMID: 37899027 Review.
References
-
- Niccoli, T. & Partridge, L. Ageing as a risk factor for disease. Curr. Biol.22, R741–R752 (2012). - PubMed
Grants and funding
LinkOut - more resources
Full Text Sources
Miscellaneous
