. 2025 Apr 26;16(1):3945.
doi: 10.1038/s41467-025-59356-3.

Perturbing local steroidogenesis to improve breast cancer immunity

Affiliations

Perturbing local steroidogenesis to improve breast cancer immunity

Qiuchen Zhao et al. Nat Commun. .

Abstract

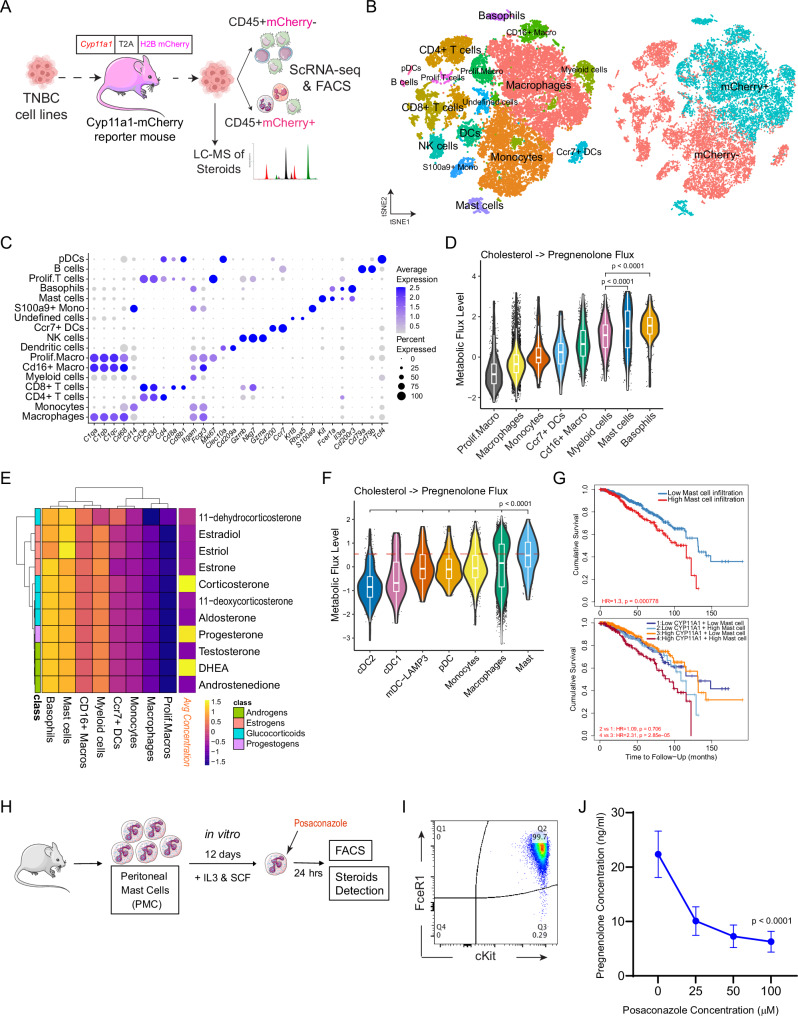
Breast cancer, particularly triple-negative breast cancer (TNBC), evades the body's immune defences, in part by cultivating an immunosuppressive tumour microenvironment. Here, we show that suppressing local steroidogenesis can augment anti-tumour immunity against TNBC. Through targeted metabolomics of steroids coupled with immunohistochemistry, we profiled the existence of immunosuppressive steroids in TNBC patient tumours and discerned the steroidogenic activity in immune-infiltrating regions. In mouse, genetic inhibition of immune cell steroidogenesis restricted TNBC tumour progression with a significant reduction in immunosuppressive components such as tumour associated macrophages. Steroidogenesis inhibition appears to bolster anti-tumour immune responses in dendritic and T cells by impeding glucocorticoid signalling. Undertaking metabolic modelling of the single-cell transcriptomics and targeted tumour-steroidomics, we pinpointed the predominant steroidogenic cells. Inhibiting steroidogenesis pharmacologically using a identified drug, posaconazole, curtailed tumour expansion in a humanised TNBC mouse model. This investigation paves the way for targeting steroidogenesis and its signalling pathways in breast cancer affected by immune-steroid maladaptation.


Conflict of interest statement

Competing interests: BM, JP and SKS declare following competing interests. An UK patent application submitted (Title: Cancer Treatments. Reference Number: P370182GB. Patent Application Number: 2502017.3) partly based on the findings in this manuscript where BM, JP and SKS are co-inventors. All other authors declare no competing interests.

Figures

Fig. 1
Fig. 1. Local steroidogenesis and steroid signalling in TNBC tumours.
A Schematic representation showcasing the integration of experimental approaches using 16 TNBC patient tumours. B Bar chart highlighting the scaled concentrations of 31 distinct steroid hormones detected in the 16 TNBC tumours via LC-MS (Mean ± SEM expressed through error bars); Source data are provided as a Source Data file. C Box plot detailing the distribution of the most abundant steroid hormone receptor, NR3C1, across TNBC tumours, derived from RNA-seq data (Jiang. et al.) from a cohort of 360 TNBC patients (NR1I3: Nuclear Receptor subfamily 1 group I member 3, AR: Androgen Receptor; NR3C1 & NR3C2: Nuclear Receptor Subfamily 3 Group C Member 1 & 2, ESR1 and 2: Estrogen Receptor 1 and 2; PGR: Progesterone Receptor); D Bar chart indicating the overall steroid hormone score derived by integrating steroid hormone concentrations and gene expression data in TNBC tumours. E Heatmap displaying the correlation between steroid receptor expression levels and different immune populations, derived from RNA-seq data (Jiang. et al.) from a cohort of 360 TNBC patients (a unpaired two-tailed t-test was performed). F Hematoxylin and Eosin (H&E) staining (top) and Immunohistochemistry (IHC) staining for CYP11A1 (bottom) in TNBC tumours, showcasing differential localization patterns. Image represents data from one representative of 16 TNBC patients. G Visual representation indicating the CYP11A1 activity levelsacross different regions of the 16 TNBC tumours (a unpaired two-tailed t-test was performed); Source data are provided as a Source Data file. H Representative immunofluorescence images of tumour sections of one out of four TNBC patients showing CD45 (green), CYP11A1 (red), and overlap. I Violin plot detailing the comparative levels of steroid biosynthesis scores in immune cells derived from tumour samples versus blood samples, based on scRNA-seq data from 22 TNBC patients. In (C) and (I), the median is used as the center, the 25th and 75th percentiles are set as the boundaries, whiskers are drawn to 1.5×IQR limits, and outliers are plotted separately; a unpaired two-tailed t-test was performed. Figure 1A was partly generated using Servier Medical Art, licensed under a CC BY 4.0 license.
Fig. 2
Fig. 2. Genetic deletion of Cyp11a1 in immune cells alters TNBC tumour dynamics and the immune landscape of the TME.
A Schematic illustration depicting the experimental strategy. B Subcutaneous E0771.LMB tumour growth curve of control versus Cyp11a1cKO mice; each data point represents average tumour size (N = 12; Two-way ANOVA for growth curves). C Representative photograph of E0771.LMB tumour in control and Cyp11a1cKO mice. D Bar chart showing the scaled concentrations of steroid hormones detected in the tumours from control and Cyp11a1cKO mice via LC-MS (N = 6 for control and N = 9 for Cyp11a1cKO). E t-SNE plots of CD45+ immune cells from control (N = 3) and Cyp11a1cKO (N = 3) mice. Different colours on the left highlight distinct immune cell subsets, while the right contrasts cell origins from control versus Cyp11a1cKO mice. F Marker gene expression across immune cell clusters of panel (E). G Relative percentages of immune cell populations between Vav1Cre control and Cyp11a1cKO mice (N = 3). H Differential M1 macrophage scores in macrophages extracted from Vav1Cre control versus Cyp11a1cKO mice. Each dot represents a single cell. The box plot shows the median as the center, the 25th and 75th percentiles as the box boundaries, whiskers extending to the most extreme values within 1.5×IQR from the quartiles, and outliers plotted separately. I Dot plot presentation of M1 versus M2 gene expression in macrophages sourced from both Vav1Cre control and Cyp11a1cKO mice. J–L Flow cytometry profiles emphasising Mertk (J), iNos (K) and Arg1 (L) expression in CD11b+ cells from Vav1Cre and Cyp11a1cKO mice (left). The adjoining chart (right) showcases the percentage expression for each group. N = 4 (J), N = 3 (K), N = 5 (L). All experiments are representative of two or three independent repeats except (DG). All error bars except H: Mean ± SEM; p values were calculated using unpaired two-tailed t-test unless stated. Source data for B, D, J & K are provided as a Source Data file. Figure 2A was partly generated using Servier Medical Art, licensed under a CC BY 4.0 license.
Fig. 3
Fig. 3. Steroidogenesis inhibition augments anti-tumour immunity by suppressing glucocorticoid (GC) signalling.
A Dot plot delineate the prevalence of steroid hormone receptor genes in tumour-infiltrating immune cells from TNBC patients. B Comparison of Tsc22d3 expression within immune cells of Vav1Cre and Cyp11a1cKO mice (sc-RNAseq). C Volcano plot depicting the differential gene expression in DCs post-steroidogenesis inhibition. p values and fold changes calculated using Seurat (version 3.2.2.). D Experimental design for E–I Human PBMC-derived monocytes were differentiated toward DCs +/− GC. E Expression levels of selected genes between GC-treated (DC-Mock) and treated (DC-GC) groups. F CD86 expression (FACS) in DC-Mock and DC-GC groups (N = 5). G Cytokine concentrations (ELISA) in DC-Mock and DC-GC groups (N = 5). HI Representative FACS profiles (left panel) and average percentage expression (right panel) of IFNg (H) and TNFa (I) in CD8 + T cells from the mixed lymphocyte response assay (naïve T and DC co-culture assay, T-DC-Mock and T-DC-GC groups, N = 3, biological replicates. J Violin plots revealing indicated gene set signature scores in DCs from scRNA-seq data of tumours of either Vav1Cre or Cyp11a1cKO mice. K Representative FACS histogram (left) and bar graph (right) displaying the expression intensity and percentage of IL-10 in DCs from Vav1Cre or Cyp11a1cKO mice (N = 5). L Violin plots reveal the indicated gene set signature scores in CD8 + T cells from scRNA-seq data of tumours of Vav1Cre and Cyp11a1cKO mice. M–N FACS diagrams (left), and bar graph (right) displaying the expression intensity and percentage of Ifng (L) and Tnfa (M) in CD8 + T cells from Vav1Cre or Cyp11a1cKO mice (N = 4). In all violin plots, each dot represents a single cell. The box plot shows the median as the center, the 25th and 75th percentiles as the box boundaries, whiskers extending to the most extreme values within 1.5×IQR from the quartiles, and outliers plotted separately. All error bars are Mean ± SEM. All p values were calculated by unpaired two-tailed t-test unless stated. Source data for F–I, K, M, N are provided as a Source Data file. N defines each individual donor or mouse or independent biological replicates. Figure 3D was partly generated using Servier Medical Art, licensed under a CC BY 4.0 license.
Fig. 4
Fig. 4. Characterization of Cyp11a1+ immunocytes in TNBC for enhanced therapeutic precision.
A Outline of the Cyp11a1-mCherry reporter mouse experiment subcutaneously transplanted with E0771.LMB cells, showcasing tumour-infiltrating immune cell (CD45+mCherry+ and CD45+mCherry cells) sorting for scRNAseq and steroid hormone analysis (B–E). B t-SNE visualization of distinct clusters in CD45+mCherry+ and CD45+mCherry immune cells from the tumour bearing reporter mice. Different colours on the left highlight distinct immune cell subsets, while the right contrasts cell origins from CD45+mCherry+ and mCherry population. C Marker gene expression for various cell clusters displayed via a dot plot. D Violin plot representation of flux levels from cholesterol to pregnenolone within CD45+mCherry+ immune cells from tumour samples. E Detailed heatmap showing variations in flux levels of steroid hormone production among different immunocytes derived from CD45+mCherry+ cells, along with the concentrations of these steroids in tumour samples. F Violin plot representation depicting flux levels from cholesterol to pregnenolone within myeloid cells from 22 TNBC patients. G Kaplan-Meier curve elucidating the correlation between both mast cell infiltration (up) and the combined impact of CYP11A1 mRNA expression with mast cell infiltration (bottom) on survival outcomes in breast cancer (BRCA) patients, analysed using the TIMER database (a two‐sided p-value was derived from the standard normal distribution). H Schematic diagram of the in vitro Posaconazole targeting strategy on mast cells. I Flow cytometry scatter plots showcasing FceR1 and cKit expression in mast cells. J Data showcasing Posaconazole impact on the pregnenolone production of mast cells (N = 4 independent biological replicates; Mean ± SEM demarcated by error bars; one-way ANOVA was performed); Source data are provided as a Source Data file. In all violin plots (D, F), each dot represents a single cell. The box plot shows the median as the center, the 25th and 75th percentiles as the box boundaries, whiskers extending to the most extreme values within 1.5×IQR from the quartiles, and outliers plotted separately. P values were calculated using unpaired two-tailed t-test unless stated. Figure 4A, H were partly generated using Servier Medical Art, licensed under a CC BY 4.0 license.
Fig. 5
Fig. 5. Therapeutic efficacy of posaconazole in TNBC preclinical models.
A Illustration of Posaconazole treatment regimen in a TNBC mouse model. B Longitudinal tumour growth curves in Posaconazole-treated and control mice over time (N = 8; (E0771.LMB injected subcutaneously, Mean ± SEM expressed through error bars; a unpaired two-tailed t-test was performed); Source data are provided as a Source Data file. C Side-by-side presentation of tumours from both Posaconazole and control groups upon study conclusion (E0771.LMB injected subcutaneously). D Heatmap depicting the immune cell populations quantified by Cibersort in tumors from control (left column) and Posaconazole-treated (right column)mice in a TNBC mouse model (E0771 injected orthotopically). EF Flow cytometry scatter plots showcasing Ifng (E) and Tnfa (F) expression in CD8+ T cells from Posaconazole-treated and control mice in TNBC mouse model (E0771.LMB injected subcuteneously). Comparative data presented on the right highlights the differential expression across groups (biological replicates, N = 6; Error bars denote mean ± SEM; a unpaired two-tailed t-test was performed); Source data are provided as a Source Data file. G Overview of the humanised mouse model setup, indicating the introduction of human TNBC cells orthotopically and subsequent Posaconazole treatment. H MRI snapshots after one week of Posaconazole administration, emphasising tumour size differences. I Quantitative 3D tumour volume representation derived from MRI scans after one week (Control group N = 3, Posaconazole-treated group N = 4; Mean ± SEM expressed through error bars; a unpaired two-tailed t-test was performed); Source data are provided as a Source Data file. J Photograph of harvested tumours from both groups at the 21-day mark. K Quantitative analysis reflecting tumour size disparities post 21 days (Control group N = 3, Posaconazole-treated group N = 4; Mean ± SEM expressed through error bars; a unpaired two-tailed t-test was performed); Source data are provided as a Source Data file. LM GSEA results of indicated gene sets between Posaconazole-treated and control groups (The calculation of GSEA results using clusterProfiler (version 3.18.1) was included in Methods). Figure 5A, H were partly generated using Servier Medical Art, licensed under a CC BY 4.0 license.
Fig. 6
Fig. 6. Diagrammatic Illustration of the Discovery.
The graphical illustration shows how local steroidogenesis affects anti-tumour immunity in TNBC. In the TNBC environment (left), steroid-producing immune cells promote tumour growth by fostering immunosuppressive elements like Tregs and tumour-associated macrophages (TAMs). In contrast, steroid inhibition (right) boosts anti-tumour immunity, enhancing CD8+ T cell and M1 macrophage activity, and restoring co-stimulation in DCs, which limits tumour growth. This suggests targeting steroidogenesis as a potential therapeutic strategy in TNBC.

References

    1. Giaquinto, A. N. et al. Breast cancer statistics, 2022. CA: A Cancer J. Clin.72, 524–541 (2022). - PubMed
    1. Arnold, M. et al. Current and future burden of breast cancer: Global statistics for 2020 and 2040. Breast66, 15–23 (2022). - PMC - PubMed
    1. Carey, L., Winer, E., Viale, G., Cameron, D. & Gianni, L. Triple-negative breast cancer: disease entity or title of convenience? Nat. Rev. Clin. Oncol.7, 683–692 (2010). - PubMed
    1. Foulkes, W. D., Smith, I. E. & Reis-Filho, J. S. Triple-negative breast cancer. N. Engl. J. Med.363, 1938–1948 (2010). - PubMed
    1. Bianchini, G., De Angelis, C., Licata, L. & Gianni, L. Treatment landscape of triple-negative breast cancer—expanded options, evolving needs. Nat. Rev. Clin. Oncol.19, 91–113 (2022). - PubMed

MeSH terms

LinkOut - more resources