. 2025 Apr 26;16(1):344.
doi: 10.1038/s41419-025-07565-5.

HSPA2 influences the differentiation and production of immunomodulatory mediators in human immortalized epidermal keratinocyte lines

Affiliations

HSPA2 influences the differentiation and production of immunomodulatory mediators in human immortalized epidermal keratinocyte lines

Agnieszka Gogler et al. Cell Death Dis. .

Abstract

Chaperone proteins constitute a molecular machinery that controls proteostasis. HSPA2 is a heat shock-non-inducible member of the human HSPA/HSP70 family, which includes several highly homologous chaperone proteins. HSPA2 exhibits a cell type-specific expression pattern in the testis, brain, and multilayered epithelia. It is a crucial male fertility-related factor, but its role in somatic cells is poorly understood. Previously, we found that HSPA2 deficiency can impair epidermal keratinocyte differentiation. In this study, we confirmed the crucial role of HSPA2 in keratinocyte differentiation by investigating immortalized keratinocytes cultured in a reconstructed human epidermis model. Moreover, we uncovered the influence of HSPA2 on immunomodulation. Transcriptomic analysis revealed that the total loss of HSPA2 affected the expression of genes related to keratinocyte differentiation and interleukin- and interferon-mediated signaling. The functional analysis confirmed bidirectional changes associated with the loss of HSPA2. The HSPA2 knockout in HaCaT and Ker-CT keratinocytes, but not HSPA2 overproduction, impaired granular layer development as evidenced by reduced levels of late keratinocyte differentiation markers, filaggrin and involucrin, along with structural abnormalities in the upper epidermal layer. Differentiation defects were accompanied by increased mRNA expression and extracellular secretion of keratinocyte-derived pro-inflammatory IL-6 cytokine and CCL2, CCL8, CXCL1, CXCL6, and CXCL10 chemokines. The loss of HSPA2 also led to increased expression of extracellular HSPA1 and interferon-stimulated genes and secretion of immune cell modulator SLAMF7. Knocking down HSPA1 expression in keratinocytes decreased the secretion of IL-6 and CCL5 release, suggesting extracellular HSPA1's role in the HSPA2-regulated molecular network. To summarize, we uncovered the complex homeostatic role of HSPA2 in epidermal keratinocytes. Our results suggest that dysfunction in HSPA2 activity could be an important pathogenicity factor and potential therapeutic target for inflammatory cutaneous diseases.


Conflict of interest statement

Competing interests: The authors declare no competing interests. Ethical approval: All methods were performed in accordance with the good scientific conduct guidelines and regulations. This study does not involve animals and human participants or human data; therefore, informed consent for participation and publication is not applicable.

Figures

Fig. 1
Fig. 1. Transcriptomic comparison of the reconstructed human epidermis (RHE) cultures formed by HSPA2+ and HSPA2- HaCaT cells (Principal Component Analysis, PCA). Datasets from KD (knockdown) and KO (knockout) cell models were analyzed together.
A The percentage of variance explained by consecutive principal components (PC) of rlog-transformed, unscaled expression levels of all genes. Dark red indicates components that collectively explain 80% of the total variance. B Two-dimensional scatter plot of scores for the first two PCs. Colors represent different cell variants, while shapes denote replicates. In the KD model, HSPA2- RHE is represented by the A2-sh4 cells (group; purple), while HSPA2+ by the CTR-luc cell variant (dark green); in the KO model, HSPA2- RHE is represented by CRISPR-2B (pink) and CRISPR-4 (violet) cells, while HSPA2+ by CRISPR-CTR (neon green) cells. Wild-type cells (wt, blue) were considered an additional variant of HSPA2+ cells. The remaining PCs are shown in Supplementary Fig. S2A–C. Results of the supervised analysis of HSPA2- versus HSPA2 + RHE variants can be found in Supplementary Fig. S2D, E (Supplementary Results).
Fig. 2
Fig. 2. Transcriptomic comparison of the reconstructed human epidermis (RHE) generated by HSPA2+ and HSPA2- cells (the KO model).
A The percentage of variance explained by consecutive principal components (PC) in a principal component analysis (PCA) of rlog-transformed, unscaled expression levels of all genes. Dark red indicates PCs that explain 80% of the total variance. B Two-dimensional scatter plot of scores for the first three PC from the PCA. Colors represent cell modification variants, and shapes represent replicates. HSPA2- RHEs are represented by two variants (groups) of modified cells: CRISPR-2B (pink) and CRISPR-4 (violet), while HSPA2+ by control variant CRISPR-CTR (mint). C Significant pathways identified in overrepresentation analysis (ORA) performed on a set of genes extracted from PC3, clustered by term similarity. D Heatmap showing expression patterns for differentially expressed genes with |log2FoldChange|>1. For most genes, the direction of expression change in HSPA2- versus HSPA2+ cells was consistent across replicates. E The top 20 significant pathways in gene set enrichment analysis (GSEA), clustered by similarity. F An annotated gene-concept network for the top 5 enriched pathways from the GSEA analysis. Fold changes for core enrichment-contributing genes in HSPA2- versus HSPA2+ RHEs are indicated with colors, with upregulated genes shown in red and downregulated in blue. Expression patterns of genes in the top three enriched pathways are illustrated in Supplementary Fig. S4.
Fig. 3
Fig. 3. Transcriptomic comparison of HSPA2- versus HSPA2+ cells grown in the reconstructed human epidermis (RHE; replicates 4–6) or standard submerged 2D culture (replicates 7–9).
A The percentage of variance explained by consecutive principal components (PC) for principal component analysis (PCA) of rlog-transformed, unscaled expression levels of all genes. Dark red indicates those components that collectively explain 80% of the total variance. B The first and fifth PC from the PCA (with the fifth PC associated with the HSPA2- group). Colors represent cells (groups), and shapes denote replicates. HSPA2- RHEs are represented by two groups of modified cells: CRISPR-2B (pink) and CRISPR-4 (violet), while HSPA2+ by control CRISPR-CTR (mint) cells. The remaining PC are shown in Supplementary Fig. S6A. C Significant pathways identified in overrepresentation analysis (ORA) performed on genes selected from PC5. D The top 20 significant pathways from gene set enrichment analysis (GSEA) are clustered by similarity. The gene-concept network showing the top 5 enriched pathways in HSPA2- cells is included in Supplementary Fig. S6B.
Fig. 4
Fig. 4. Relationship between HSPA2 levels and HaCaT cell differentiation in reconstructed human epidermis (RHE) cultures.
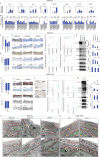
A Expression of genes related to keratinocyte differentiation in HSPA2+ (CRISPR-CTR) RHE cultured for 3, 12, and 18 days. Results of RT-qPCR analysis (mean ± SD, n = 3 or n = 2 in case of WNT11 and ABCA4), each in three technical replicates); gene expression data were normalized to the geometric mean of two reference genes (TMEM, TBCB). Graphs show fold changes (ΔΔCT) for 18-day RHE, relative to expression in 3-day RHE cultures. B Results of RT-qPCR show the expression of differentiation-related genes during the formation of HSPA2+ and HSPA2- (CRISPR-2B, CRISPR-4) RHE cultures at 3, 12, or 18 days. Plots show fold changes (mean ± SD, n = 3 or n = 2 in the case of WNT11 and ABCA4) calculated relative to HSPA2+ samples (for LCE3D relative to reference gene index (ΔCT)). PCR starters are listed in Supplementary Table S1. C, H Plots show the results of RHE thickness evaluation (mean ± SD) in KO (C) and OVER (H) models. Hematoxylin-eosin-stained cross-sections of 18-day (fully-developed) RHE samples were measured (KO model, n = 4; OVER model, n = 3) using ImageJ software. For each biological repeat, at least 6 photomicrographs were analyzed, and the average of 12 measurements of each RHE was used for the statistical analysis. Results are reported in pixel density values. D, I The Ki-67 proliferation index is calculated as the ratio of Ki-67-positive nuclei to the total number of cells in the basal layer of 18-day RHE. Data are expressed as mean ± SD (n = 3). E, J Representative microphotographs showing DAB-mediated immunostaining of HSPA2, epidermal differentiation markers (K10, FLG, IVL) and proliferation marker (Ki67), in formalin-fixed cross-sections of 18-day RHE. KO model (n = 4) (E), OVER model (n = 5) (J). The bar represents 100 µm. F, L Quantitative analysis of keratinocyte differentiation marker immunostaining, performed using a custom computational algorithm [27]. Each point in the plots represents an analyzed image and corresponds to the result of staining proportion score assessment (KO model, n = 4; OVER model, n = 3). G, M Western blot analysis of FLG, IVL, K10 levels in 18-day HSPA2- (G) and HSPA2-OVER (M) RHEs (n = 2). Representative immunoblots are shown. β-actin was used as a protein loading control, with blots generated using 25–35 µg of total protein. K Immunocytochemistry-mediated detection of HSPA2 in control and HSPA-OVER cells growing in standard 2D culture (n = 2). Antibodies are listed in Supplementary Table S2. N, O Structural features of the uppermost layers of 18-day RHE cultures formed by cells of KO (N) and OVER (O) models. Representative microphotographs were taken with transmission electron microscopy. Each red line indicates the cell layer, the green line encircles the nucleus, and the yellow letter K denotes keratohyalin granules. The scale bar represents magnification. The experiment was performed in duplicate. Microphotographs without markings are provided in Supplementary Fig. S7. Statistical significance of differences in (AD, G, H, M) was calculated using a two-tailed t-test, *P ≤ 0.05. For statistical analysis in (F) and (L) the Kruskal–Wallis test was used with the post-hoc Nemenyi test to determine significant differences between groups, *P ≤ 0.05.
Fig. 5
Fig. 5. Effects of HSPA2 loss on Ker-CT cell differentiation in reconstructed human epidermis (RHE) cultures.
A Western Blot detection of HSPA2 and HSPA1 in wild-type (wt), CRISPR/Cas9-edited control (CRISPR-CTR, a pool of four non-edited isogenic clones) and HSPA2-null (CRISPR-2 and CRISPR-5, a pool of two and five HSPA2- isogenic clones, respectively) cells. Representative immunoblots are shown (n = 2); β-actin was used as a protein loading control. Graphs below immunoblots show results of densitometry quantification of band intensity. B Representative microphotographs showing hematoxylin-eosin-stained cross-sections of 18-day (fully-developed) RHE cultures formed by control and HSPA2- Ker-CT cells, SB – stratum basale, SS – stratum spinosum, SG – stratum granulosum, SC – stratum corneum. C Plot shows the results of RHE thickness evaluation (mean ± SD) (n = 3; for each biological repeat at least 2 technical RHE samples were analyzed, and the average of 7 measurements of each RHE was used for the statistical analysis) using ImageJ software. Results are reported in pixel density values. D Representative microphotographs showing DAB-mediated immunodetection of undifferentiated keratinocyte markers (K14, p63) and epidermal differentiation markers (FLG, IVL) in formalin-fixed cross-sections of 18-day RHE (n = 3). The bar represents 100 µm. E Quantitative analysis of marker immunostaining. A custom computational algorithm was used [27]. Each point in the plots represents an analyzed image and corresponds to the result of the staining proportion score assessment (n = 3). Statistical significance of differences in (A, C) was calculated using a two-tailed t-test, *P ≤ 0.05. For statistical analysis in (E) the Kruskal–Wallis test was used with the post-hoc Nemenyi test to determine significant differences between groups, *P ≤ 0.05.
Fig. 6
Fig. 6. Link between HSPA2 expression levels and the production or secretion of proinflammatory mediators in RHE cultures.
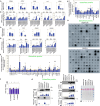
A Expression of genes involved in Signaling by Interleukins pathway in control CRISPR-CTR cells grown for 3, 12, and 18 days in RHE culture. RT-qPCR analysis results (mean ± SD, n = 3, or n = 2 in case of CXCL1, JUN, and FOS; each with three technical replicates) are shown; gene expression data were normalized to the geometric mean of two reference genes (TMEM, TBCB). The graph shows fold changes (ΔΔCT) relative to the expression level in the 3-day RHE culture. B Expression of genes in Signaling by Interleukins pathways during the growth (3, 12, 18 days) of HSPA2+ (CRISPR-CTR) and HSPA2- (CRISPR-2B, CRISPR-4) RHE cultures. RT-qPCR results show fold changes (mean ± SD, n = 3, or n = 2 in case of CXCL1, JUN and FOS) relative to HSPA2 + RHE cultures. PCR primers are listed in Supplementary Table S1. C Intracellular and D, E extracellular (in conditioned media) levels of pro-inflammatory proteins detected by antibody array in HSPA2+ and HSPA2- RHE cultures after 18 days of growth. The graphs in (C) and (E) show results (mean ± SD) of densitometric quantification of antibody microarray spots, the data represent the combined measurements for CRISPR-2B and CRISPR-4 RHEs (n = 2 for each variant in (C), n = 3 for each variant in (E)) expressed relatively to HSPA2+ RHE after normalization to the internal positive control spots (POS; spots of intensity ≤0.3 relative to POS were excluded from the analysis). In (D), representative antibody arrays showing levels of proinflammatory proteins in conditioned medium from HSPA2+ and HSPA2- RHE cultures. F Fraction of dead cells detected by trypan blue staining method after 24 h exposure to the M5 cocktail under standard 2D in vitro culture conditions (10 nM concentration of each cytokine). G Representative immunoblots (n = 3) showing the levels of HSPA1, HSPA2, IL-6, CCL2, and CCL5 proteins in conditioned media from unstimulated and M5-stimulated cells. Graphs below immunoblots show results of densitometry quantification of band intensity. Antibodies used in WB are listed in Supplementary Table S2. Ponceau red-stained blot shows protein loading. 20 µl of concentrated medium was loaded per well. Conditioned media (in D, G) were collected from cells grown in serum-free OptiMem medium. Statistical significance was calculated using a two-tailed t-test, *P ≤ 0.05. In (C) and (E) *P ≤ 0.05; #P ≤ 0.10.
Fig. 7
Fig. 7. Relationship between HSPA2 expression levels and interferon signaling pathway in HaCaT cells.
A Expression of genes involved in the Interferon Signaling pathway in control (HSPA2 + ) CRISPR-CTR cells grown for 3, 12 and/or 18 days in RHE culture. Results of the RT-qPCR analysis (mean ± SD, n = 2 or n = 4, each with three technical replicates). Gene expression data were normalized to the geometric mean of two reference genes (TMEM, TBCB). The graph shows fold changes (ΔΔCT) relative to expression level in 3-day RHE culture. B Expression of genes in Interferon Signaling pathways during growth (3, 12 and/or 18 days) of HSPA2+ (CRISPR-CTR) and HSPA2- (CRISPR-2B, CRISPR-4) RHE cultures. RT-qPCR results show fold changes (mean ± SD, n = 2 or n = 4) relative to HSPA2+ RHE cultures. PCR primers are listed in Supplementary Table S1. C Immunoblots showing the levels of HSPA2, Casp1, and SLAMF7 proteins in cell lysates from HSPA2+ (CRISPR-CTR) and HSPA2- (CRISPR-2B, CRISPR-4) RHEs on days 3 and 18 of growth. Representative immunoblots are shown (n = 2). D Immunoblots showing the intracellular or extracellular (in concentrated conditioned medium) levels of SLAMF7 protein in control (HSPA2+) CRISPR-CTR and HSPA2- (CRISPR-2B; CRISPR-4) cells. Conditioned media were collected from cells cultivated in serum-free OptiMem medium. β-actin was used as a protein loading control. Graphs on the right side of immunoblots (in C and D) show results of the densitometry quantification of band intensity. Antibodies used in IHC and WB experiments are listed in Supplementary Table S2. In (C) and (D) 50–70 μg of protein sample per well was added. The Ponceau red-stained blot is shown as a protein loading control for a concentrated conditioned medium (18 µl was loaded per well). Representative immunoblots are shown (n = 2). Statistical significance of differences was calculated using a two-tailed t-test, *P ≤ 0.05.
Fig. 8
Fig. 8. The effect of HSPA1 deficiency on the secretory profile of HSPA2-null HaCaT cells.
A Representative immunoblots (n = 3) showing detection of HSPA1, HSPA2, HSPA8, HSPC, and SLAMF7 in control CRISPR-CTR (HSPA2+) cells, and in CRISPR-4 (HSPA2-) cells lentivirally transduced with non-targeting shRNA (CRISPR-4/HSPA1+(Luc)), or with HSPA1-targeting shRNA-N (CRISPR-4/HSPA1-(N)) or shRNA-S (CRISPR-4/HSPA1-(S)). β-actin was used as a protein loading control. Graphs on the right side of the immunoblots show the results of the densitometry quantification of band intensity. 35 or 70 μg (for SLAMF7 detection) of protein sample per well was added. B Extracellular (in conditioned media) levels of HSPA1, HSPA8, and SLAMF7 proteins in cells cultured under standard (2D) culture conditions. Graphs on the right side of the representative immunoblots (n = 2) show the results (mean ± SD) of the densitometry quantification of band intensity. Ponceau red-stained blot shows protein loading. 20 µl of concentrated medium was loaded per well. Conditioned media (in B, C) were collected from cells cultivated in serum-free OptiMem medium. C Extracellular levels of pro-inflammatory proteins (in conditioned media) detected by antibody array in cells growing under standard (2D) culture conditions. D The graph shows results (mean ± SD) of densitometric quantification of antibody microarray spots and represents the combined measurements for CRISPR-4/HSPA1-(N) and CRISPR-4/HSPA1-(S) cells (n = 2 for each variant) expressed relatively to CRISPR-4/HSPA1+ (Luc) cells after normalization to the internal positive control spots (POS; array spots of intensity ≤0.3 relative to POS were excluded from the analysis). The antibodies used in WB are listed in Supplementary Table S2. Statistical significance of differences between HSPA2-/HSPA1+ (CRISPR-4/HSPA1+ (Luc)) versus HSPA2-/HSPA1-deficient cells was calculated using a two-tailed t-test, *P ≤ 0.05. In (D) *P ≤ 0.05; #P ≤ 0.10.
Fig. 9
Fig. 9. Gene-disease associations related to HSPA2 loss.
Disease enrichment map obtained by performing GSEA for DisGeNET pathways (https://www.disgenet.org/) on all genes ranked according to the test statistic in supervised differential expression analysis for the KO model samples.

Similar articles

References

    1. Kampinga HH, Hageman J, Vos MJ, Kubota H, Tanguay RM, Bruford EA, et al. Guidelines for the nomenclature of the human heat shock proteins. Cell Stress Chaperones. 2009;14:105–11. - PMC - PubMed
    1. Scieglinska D, Krawczyk Z. Expression, function, and regulation of the testis-enriched heat shock HSPA2 gene in rodents and humans. Cell Stress Chaperones. 2015;20:221–35. - PMC - PubMed
    1. Kodiha M, Chu A, Lazrak O, Stochaj U. Stress inhibits nucleocytoplasmic shuttling of heat shock protein hsc70. Am J Physiol Cell Physiol. 2005;289:C1034–41. - PubMed
    1. Scieglinska D, Piglowski W, Mazurek A, Malusecka E, Zebracka J, Filipczak P, et al. The HspA2 protein localizes in nucleoli and centrosomes of heat shocked cancer cells. J Cell Biochem. 2008;104:2193–206. - PubMed
    1. Hightower LE, Guidon PT Jr. Selective release from cultured mammalian cells of heat-shock (stress) proteins that resemble glia-axon transfer proteins. J Cell Physiol. 1989;138:257–66. - PubMed

LinkOut - more resources