. 2025 Apr 26;16(1):3937.
doi: 10.1038/s41467-025-59330-z.

CLAVATA signalling shapes barley inflorescence by controlling activity and determinacy of shoot meristem and rachilla

Affiliations

CLAVATA signalling shapes barley inflorescence by controlling activity and determinacy of shoot meristem and rachilla

Isaia Vardanega et al. Nat Commun. .

Abstract

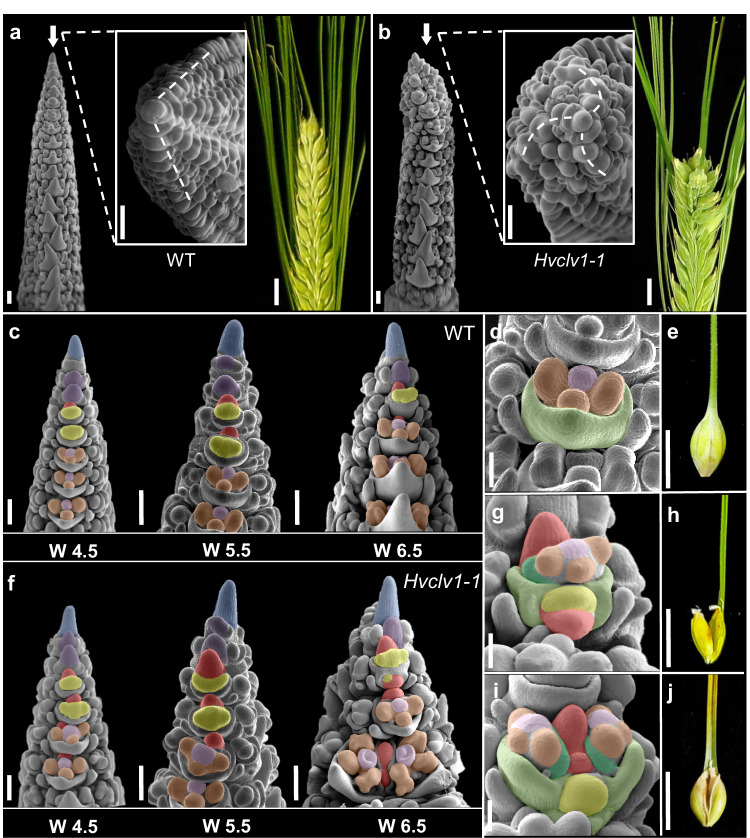
The large variety of inflorescence architectures evolved in grasses depends on shape, longevity and determinacy of meristems directing growth of the main and lateral axes. The CLAVATA pathway is known to regulate meristem size and inflorescence architecture in grasses. However, how individual meristem activities are determined and integrated to generate specific inflorescences is not yet understood. We found that activity of distinct meristems in the barley inflorescence is controlled by a signalling pathway comprising the receptor-like kinase Hordeum vulgare CLAVATA1 (HvCLV1) and the secreted CLAVATA3/EMBRYO-SURROUNDING REGION RELATED (CLE)-family peptide FON2-LIKE CLE PROTEIN1 (HvFCP1). HvFCP1 and HvCLV1 interact to promote spikelet formation, but restrict inflorescence meristem and rachilla proliferation. Hvfcp1 or Hvclv1 mutants generate additional rows of spikelets and supernumerary florets from extended rachilla activity. HvFCP1/HvCLV1 signalling coordinates meristem activity through regulation of trehalose-6-phosphate levels. Our discoveries outline a path to engineer inflorescence architecture via specific regulation of distinct meristem activities.


Conflict of interest statement

Competing interests: The authors declare no competing interests.

Figures

Fig. 1
Fig. 1. Identification, protein localisation and expression pattern of HvCLV1 in different meristems comprising the barley inflorescence.
a Maximum likelihood tree of the HvCLV1 subclade. Black dots indicate nodes with bootstrap values higher than 80. Gene identifiers are shown next to a schematic representation of protein structures. Kinase domain in purple and LRRs in green. HvCLV1 is highlighted in light orange. b SEM picture of barley vegetative meristem. Colour code: shoot apical meristem (SAM) in blue, leaf primordia (LP) in white. c smRNA-FISH detection of HvCLV1 transcripts (red dots) at the vegetative stage, calcofluor stained cell wall in grey. d HvCLV1 protein localisation in a central longitudinal section of the SAM at vegetative stage, HvCLV1 proteins tagged with mVenus in green. e Hordeum vulgare inflorescence cv. Golden Promise Fast, W3.5. Colour code: inflorescence meristem (IM) in blue, triple spikelet meristem (TSM) and central spikelet meristem (CSM) in purple, lateral spikelet meristem (LSM) in orange, rachilla primordium (RP) in red, floret meristem (FM) in yellow, lemma primordium (LEP) in light green, palea primordium (PP) in dark green, stamen primordia (SP) in brown, carpel primordium (CP) in pink and glumes primordia (GP) in cyan. f, g Transcripts and proteins localisation of HvCLV1 in the IM and TSMs, h, i in spikelet primordia at the FM initiation stage. The white arrows indicate the RP. j Central longitudinal section of SM. Segmented lines indicate RP and FM. The close-up pictures show HvCLV1 proteins internalised in the vacuole in the RP and HvCLV1 proteins localised on the plasma membrane in the FM. k Quantification of HvCLV1 protein internalisation in RP and FM. Dots represent single measurements, and asterisks indicate the significant difference between samples using a two-sided Wilcoxon rank sum exact test. n = 8 central spikelets over n = 2 independent experiments. Boxplots: median (centre line); upper and lower quartiles (box limits); 1.5x interquartile range (whiskers). l, m HvCLV1 transcripts and proteins localisation in stamens and carpel primordia. HvCLV1 transcripts are in red and HvCLV1 proteins in green. Scale bars = 50 µm, in e = 100 µm. Statistics: ns non-significant (p-value > 0.05); *(p-value < 0.05); **(p-value < 0.01); ***(p-value < 0.001).
Fig. 2
Fig. 2. HvCLV1 impacts plant and spike architecture, delays inflorescence development and promotes spikelet formation.
a Hordeum vulgare cv. Golden Promise Fast (WT) plants versus three selected Hvclv1 mutant alleles (Hvclv1-1, Hvclv1-2, Hvclv1-3). b, c WT inflorescence and Hvclv1-1 crowned spike phenotype, respectively; ectopic grains are indicated by white arrows. d Percentage of crowned spikes in WT and Hvclv1 mutant alleles. e, f Close up on WT single grain and Hvclv1-1 multi-grain developed from multi-floret spikelets. g Percentage of spikes with multi-grain in WT plants and Hvclv1 mutant alleles. In (d, g) dots represent the percentage of spikes per plant exhibiting the phenotype from n = 9 plants over n = 3 independent experiments. h, i Stereo microscope pictures of WT and Hvclv1-1 inflorescence development from 7 to 22 days after sowing (DAS) and quantification of developmental progression and number of spikelet primordia. WT in yellow, Hvclv1-1 in purple. Dots: single measurements; error bars: standard deviation; coloured ribbon: interval of confidence. In (h) and (i) n = 10 and n = 7 inflorescences were analysed over n = 3 independent experiments, respectively. j Days required for the main tiller to reach heading stage in WT and Hvclv1 mutant alleles. n = 10 plants were sown over one experiment. Due to failure in grain germination, n = 9 and n = 8 data points were obtained from WT and Hvclv1-2, respectively. k Examples of WT and Hvclv1-1 IMs at W2.5, 4.5 and 6.5. Stained cell wall in white. IM width and height at different W were measured by tracing a horizontal line from the last visible spikelet primordium (IM width) and a perpendicular vertical line connecting it to the highest IM point (IM height) in WT (yellow) and Hvclv1-1 (purple) inflorescences (white segmented lines). n = 5 samples/genotype were measured for every W. Scale bar = 5 cm in (a), 1.5 cm (b, c, e, f), 100 μm (h) and 50 μm (k). Boxplots: median (centre line); upper and lower quartiles (box limits); 1.5x interquartile range (whiskers), dots (single measurements). Statistics: asterisks indicate the significant difference in comparison to WT using a two-sided Pairwise Wilcoxon rank sum test (d, g, h, i, j) or a two-sided Pairwise t-test (k). ns non-significant (p-value > 0.05); *(p-value < 0.05); **(p-value < 0.01); ***(p-value < 0.001).
Fig. 3
Fig. 3. The origin of crowned spikes and multi-floret spikelets.
a, b SEM pictures showing frontal and top view of WT and Hvclv1-1 inflorescences at W4.5 respectively. Segmented lines indicate spikelet primordia phyllotaxis. Pictures of representative spike phenotypes on the right. Crowned spikes were found in 6/38 Hvclv1-1 inflorescences from W5.5 to W6.5 c Developmental progression of WT inflorescences at W4.5, 5.5 and 6.5. Colour code as described (see above). d, e Close-up on WT floret and WT single grain respectively. f Developmental progression of Hvclv1-1 inflorescences at W4.5, 5.5 and 6.5. Colour code as described (see above). Multi-floret spikelets were found in 27/38 Hvclv1-1 inflorescences from W5.5 to W6.5. gj Close up on Hvclv1-1 multi-floret spikelet and the resulting multi-grain disposed vertically (g, h) and horizontally (i, j). Multi-floret spikelets disposed vertically were observed in 24/38 inflorescences and horizontally in 10/38 inflorescences. All the inflorescences for SEM pictures were collected from the main tiller of plants grown under the same conditions over n = 4 independent experiments. Colour code (gj): RP and secondary rachilla in red, FM in yellow, LP in light green, PP in dark green, SP in brown and CP in pink. Scale bars: ac, f = 200 µm; d, g, i = 100 µm; e, h, j = 1 cm.
Fig. 4
Fig. 4. HvFCP1 interacts with HvCLV1 to regulate IM and RP size and determinacy.
a Vegetative shoot apical meristem (vSAM) height and width in control samples (white background) and samples treated with HvFCP1 synthetic peptide (pHvFCP1) (grey background). WT vSAMs in yellow and Hvclv1-1 in purple. Dots represent single measurements, n number of samples over n = 3 independent experiments. The letters on top of each boxplot represent the results of a two-sided Pairwise Wilcoxon rank sum test. bd Confocal images of barley SAM and inflorescence expressing HvFCP1 transcriptional reporter line (pHvFCP1:mVenus-H2B) at different developmental stages and in different organ primordia. SAM at vegetative stage (b), at W2.5 (c) and W3.5 (d). e HvFCP1 transcriptional reporter line along rachilla development. From central spikelet meristem (CSM) to rachilla primordium (RP). Inflorescence phenotype in late stages of development (W4.5, W5.5, W7) in WT (f) and Hvfcp1-1 (g). Multi-floret spikelets were found in 12/35 Hvfcp1-1 inflorescences from W5.5 to W6.5 over n = 4 independent experiments. Colour code as described (see above) hj 3D reconstruction of WT, Hvclv1-1 and Hvfcp1-1 IMs at W4.5 and W6.5 (h). Cells in cyan were selected for the IM measurements and n = 5 IMs were analysed for each genotype and developmental stage over n = 3 independent experiments in (i) and (j). A horizontal line was drawn from the last visible primordium, and all the above cells were considered part of the IM. Boxplots display IM volume and cell number, respectively. WT (yellow), Hvclv1-1 (purple), Hvfcp1-1 (cyan). Asterisks indicate the significant difference to WT using a two-sided Pairwise t-test. Boxplots: median (centre line); upper and lower quartiles (box limits); 1.5x interquartile range (whiskers). Scale bars: 50 µm (be, h) and 200 µm (f, g). Statistics: ns non-significant (p-value > 0.05); *(p-value < 0.05); **(p-value < 0.01); ***(p-value < 0.001).
Fig. 5
Fig. 5. HvCLV1 and HvFCP1 repress RP elongation, Hvclv1;Hvfcp1 double mutant and reporter lines in the respective mutant backgrounds.
a SEM pictures of WT, Hvclv1-1 and Hvfcp1-1 inflorescences at W6.5 were used as a reference for matching longitudinal sections on their right. The RP is highlighted in red in the three stages of flower development: floret meristem (FM), early carpel (EC), and late carpel stage (LC). White arrows indicate the spikelet stage considered as FM within the image. b Boxplots displaying rachilla area from central longitudinal sections in WT (yellow), Hvclv1-1 (purple), Hvfcp1-1 (cyan). Asterisks indicate the significant difference to WT using a two-sided Pairwise Wilcoxon rank sum test. n = 8 inflorescences were analysed for each genotype and used to image spikelets at different developmental stages over n = 2 independent experiments. c Measurements of FM area from SEM frontal pictures of barley inflorescences at W5.5 in WT, Hvclv1-1 and Hvfcp1-1. Dots represent biological replicates, and asterisks indicate the significant difference to WT using a two-sided t-test. n = 10 SEM images over n = 4 independent experiments. d Inflorescence phenotype of Hvclv1;Hvfcp1 at W5.5 and W6.5, which exhibited occasional crowned spike phenotype. Colour code as described (see above). HvCLV1 proteins localisation (green) in WT (e, g) and Hvfcp1-1 (f, h) IM and RM (segmented line) respectively. il HvFCP1 expression pattern (magenta) respectively in WT and Hvclv1-1 IM. (r, s) HvFCP1 expression pattern (magenta) in WT (i, k) and Hvfcp1-1 (j, l) IM and RM (segmented line), respectively. Boxplots: median (centre line); upper and lower quartiles (box limits); 1.5x interquartile range (whiskers); points, outliers. Scale bars in a: SEM pictures of the inflorescence tip = 200 µm; SEM pictures of flowers and all sections = 50 µm, in d = 200 µm, in el = 50 µm. Statistics: ns non-significant (p-value > 0.05); *(p-value < 0.05); **(p-value < 0.01); ***(p-value < 0.001).
Fig. 6
Fig. 6. Comparative transcriptome analysis of similarly regulated genes in Hvclv1 and Hvfcp1 vs WT, and schematic summary.
a Similarly regulated genes in Hvclv1 vs WT and Hvfcp1 vs WT from RNA sequencing results. Black arrows pointing upward indicate upregulated genes, while arrows pointing downward indicate downregulated genes. b Schematic representation of HvCLV1 (green) and HvFCP1 (magenta dots) expression patterns in barley inflorescence at W5.5. ce Schematic representation of barley inflorescences at W5.5 (left) and mature spikes (right) in WT (c), Hvfcp1, Hvclv1 and Hvclv1;Hvfcp1 (d, e). Grey bars indicate the observed spike phenotypes (multi-floret spikelets and crowned spikes) in the respective genetic backgrounds. All elements in (be) were drawn using PowerPoint. Colour code: IM and RMs are marked in red or blue to indicate meristematic proliferation or termination, respectively. FM and floral organs are marked in yellow; the main rachis and grains are marked in dark and light green.

Similar articles

Cited by

  • How meristems shape plant architecture in cereals-Cereal Stem Cell Systems (CSCS) Consortium.
    Dresselhaus T, Balboni M, Berg L, Dolata A, Hochholdinger F, Huang Y, Jiang G, von Korff M, Ku JC, van der Linde K, Maika J, Mondragon CL, Raissig MT, Schnittger A, Schnurbusch T, Simon R, Stahl Y, Timmermans M, Thirulogachandar V, Zhao S, Zhou Y. Dresselhaus T, et al. Plant Cell. 2025 Jul 1;37(7):koaf150. doi: 10.1093/plcell/koaf150. Plant Cell. 2025. PMID: 40578304 Free PMC article. Review.

References

    1. Zhang, D. & Yuan, Z. Molecular Control of Grass Inflorescence Development. Annu. Rev. Plant Biol.65, 553–578 (2014). - PubMed
    1. Koppolu, R. & Schnurbusch, T. Developmental pathways for shaping spike inflorescence architecture in barley and wheat. J. Integr. Plant Biol.61, 278–295 (2019). - PubMed
    1. Kyozuka, J., Tokunaga, H. & Yoshida, A. Control of grass inflorescence form by the fine-tuning of meristem phase change. Curr. Opin. Plant Biol.17, 110–115 (2014). - PubMed
    1. Wang, L. et al. Coordinated regulation of vegetative and reproductive branching in rice. Proc. Natl. Acad. Sci.112, 15504–15509 (2015). - PMC - PubMed
    1. Bommert, P. & Whipple, C. Grass inflorescence architecture and meristem determinacy. Semin. Cell Dev. Biol.79, 37–47 (2018). - PubMed

MeSH terms

Substances

LinkOut - more resources