. 2025 Apr 26;15(1):14665.
doi: 10.1038/s41598-025-95003-z.

A feasibility of computational drug screening for Fuchs endothelial corneal dystrophy

Affiliations

A feasibility of computational drug screening for Fuchs endothelial corneal dystrophy

Itsuki Oka et al. Sci Rep. .

Abstract

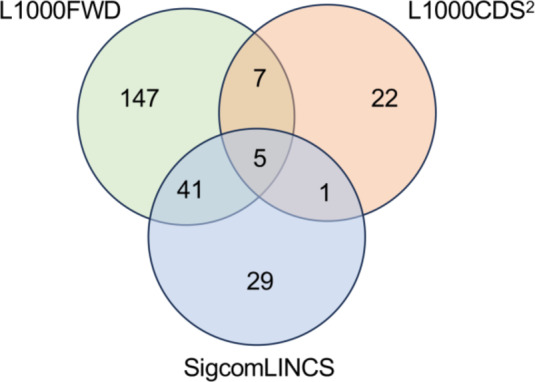
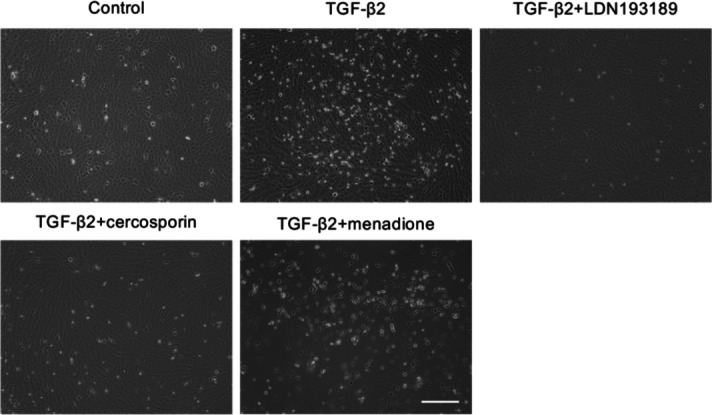
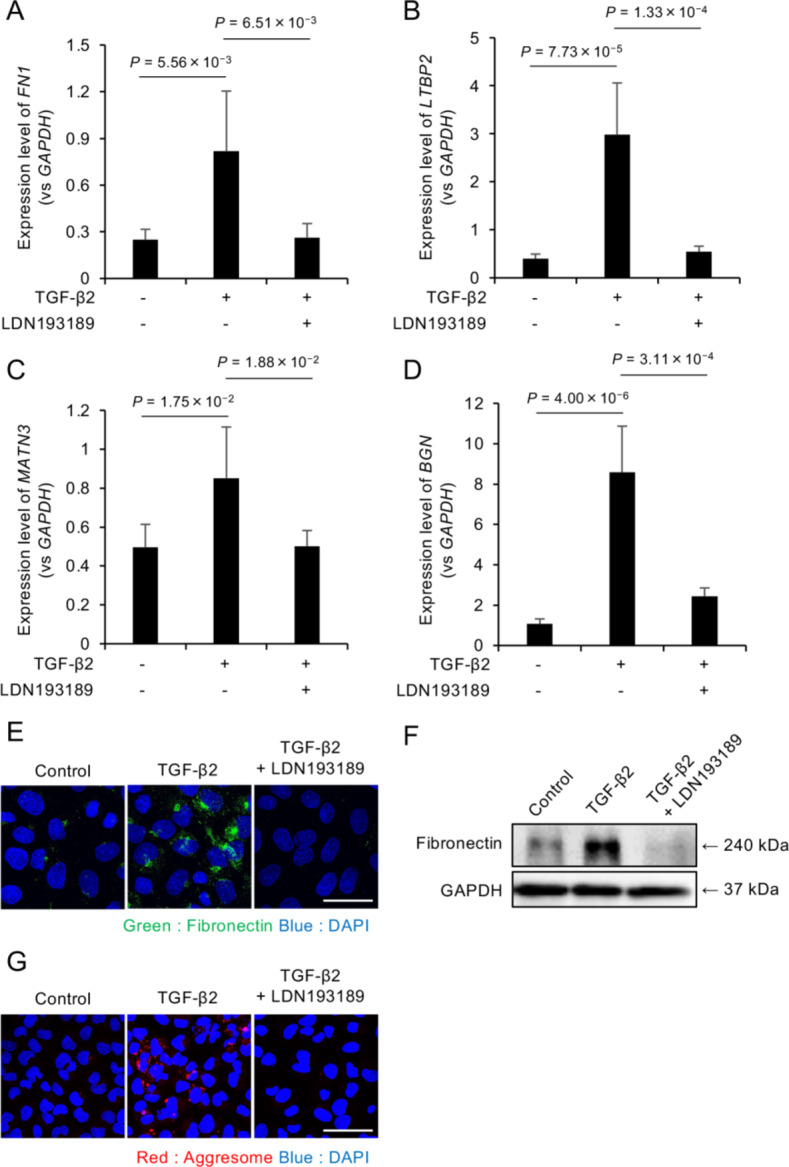
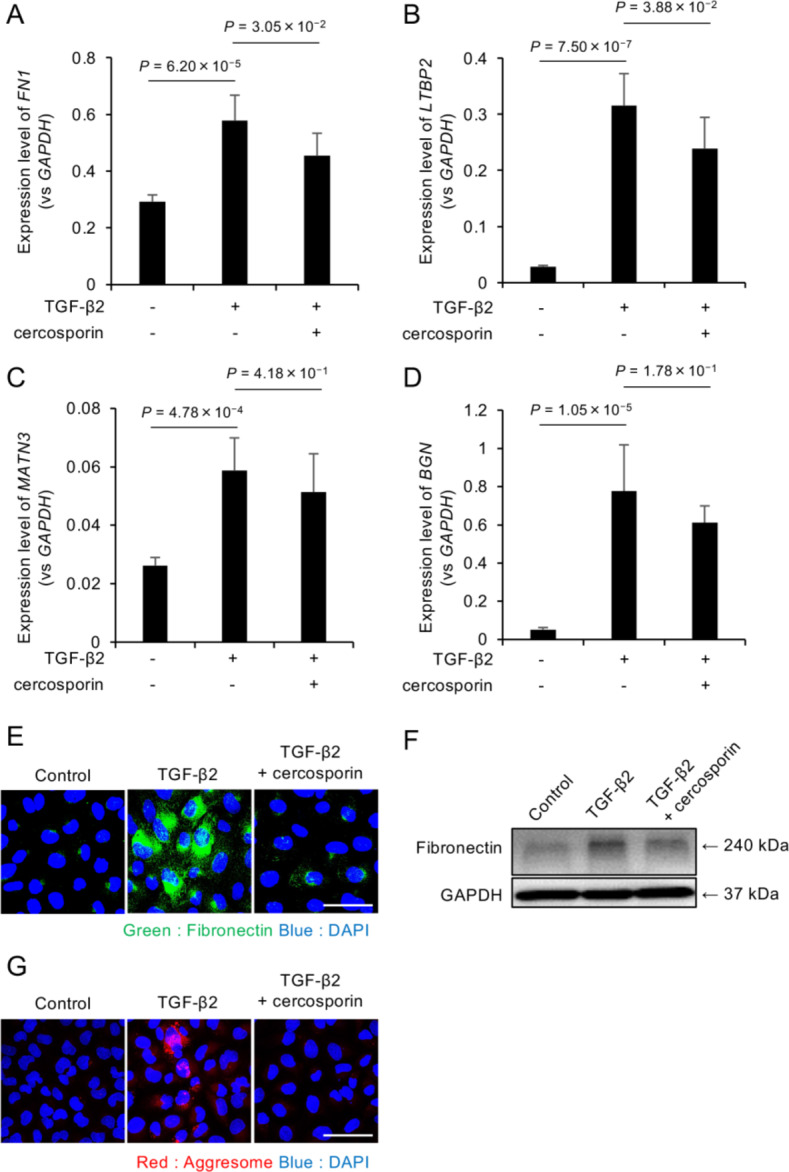
Fuchs endothelial corneal dystrophy (FECD) remains a leading cause of corneal blindness globally, with corneal transplantation being the primary treatment. FECD is characterized by the formation of guttae, extracellular matrix (ECM) deposits beneath the corneal endothelium, and progressive endothelial cell loss. These pathological changes cause visual deterioration through light scattering by guttae and corneal edema due to endothelial cell loss. However, limitations such as donor shortage and graft failure necessitate alternative therapeutic approaches. We employed computational drug screening using three platforms (L1000FWD, L1000CDS2, and SigCom LINCS) to identify compounds capable of normalizing FECD-associated differentially expressed genes (DEGs). Analysis of transcriptome data from FECD patients with TCF4trinucleotide repeat expansion identified 706 upregulated and 962 downregulated genes. The screening platforms identified 200, 35, and 76 compounds through L1000FWD, L1000CDS2, and SigCom LINCS, respectively, with five compounds commonly predicted across all platforms. Among these, LDN193189 and cercosporin were selected for further evaluation based on availability and lack of cytotoxicity. Both compounds significantly decreased the expression of ECM-related genes (FN1, MATN3, BGN, and LTBP2) in FECD cell models and suppressed TGF-β-induced fibronectin expression. Additionally, both compounds reduced aggresome formation to normal control levels, suggesting protection against endoplasmic reticulum stress-induced cell death. This study demonstrates the feasibility of computational drug screening for identifying therapeutic candidates for FECD, with LDN193189 and cercosporin showing promise in normalizing FECD-associated pathological changes.


Conflict of interest statement

Declarations. Competing interests: Naoki Okumura and Noriko Koizumi are co-founders of ActualEyes Inc., which is currently developing a pharmaceutical therapy for treating Fuchs endothelial corneal dystrophy. Other authors do not have a competing financial interest.

Figures

Fig. 1
Fig. 1
Schematic workflow of drug candidate identification for FECD treatment. Flowchart illustrating the systematic four-step approach taken to identify therapeutic candidates for FECD. Step 1 (Data preparation) began with RNA-Seq analysis of corneal endothelium from FECD patients and non-FECD subjects, followed by identification of differentially expressed genes (DEGs). Step 2 (Drug screening) involved primary screening using three computational platforms (L1000FWD, L1000CDS², and SigCom LINCS) to identify drug candidates that could normalize DEG transcript levels. Step 3 (Drug prioritization) consisted of secondary screening to identify compounds consistently prioritized across all three computational platforms. Step 4 (In vitro validation) evaluated the therapeutic potential of the prioritized drug candidates through experimental validation using multiple in vitro techniques including qPCR and western blotting, ultimately leading to validated drug candidates for FECD treatment.
Fig. 2
Fig. 2
L1000FWD-based visualization of drug candidates for FECD gene expression reversal. (A) Drug landscape visualization generated by L1000FWD analysis of differentially expressed genes (DEGs) from FECD patients with TCF4 trinucleotide repeat expansion (TNR > 50) compared to non-FECD subjects (706 upregulated and 962 downregulated genes). The plot displays 16,849 compounds clustered by their mode of action (MOA), represented by the different colors indicated in the legend. The shape of each plot represents the duration of drug exposure (Time) in the corresponding cell line (6, 24, or 48 h) as shown in the legend. (B) Score-based visualization of 10,655 identified drug candidates. The color gradient represents the compound effects on FECD-associated gene expression, where blue indicates reversers (compounds that normalize dysregulated gene expression toward the expression observed in non-FECD patterns) and red indicates mimickers (compounds that enhance FECD-associated expression patterns). The color intensity corresponds to the magnitude of effect ( −0.13 to 0.11). These visualizations were generated by the authors using the L1000FWD web-based tool ( https://maayanlab.cloud/L1000FWD/ ), which is freely available for academic research under open access principles. The visualizations shown are direct outputs from our analysis using this tool and are displayed under academic fair use principles and in accordance with the tool’s terms of use.
Fig. 3
Fig. 3
Computational drug screening results from L1000CDSand SigCom LINCS platforms. (A) L1000CDSanalysis results showing the top 14 drug candidates identified from screening of FECD-associated DEGs (706 upregulated and 962 downregulated genes from FECD patients with TCF4 TNR > 50). The table displays comprehensive information, including rank, search score, gene overlap visualization, perturbation details, and experimental conditions (cell line, dose, and duration of treatment). (B) Heat map visualization of gene expression signatures for the top 50 drug candidates identified by L1000CDS2. The map illustrates the impact of each compound on FECD-associated DEGs, with rows representing input genes and columns representing drug candidates. Color intensity indicates the degree of expression changes (red: upregulation; blue: downregulation). (C, D) SigCom LINCS analysis results presenting the top 10 compounds categorized as (C) reversers (compounds that normalize FECD gene expression patterns) and (D) mimickers (compounds that enhance FECD-associated expression patterns). These visualizations were generated by the authors using the L1000CDS2 ( https://maayanlab.cloud/L1000CDS2/ ) and SigCom LINCS ( https://maayanlab.cloud/sigcom-lincs/ ) web-based tools, which are freely available for academic research under open access principles. The visualizations shown are direct outputs from our analysis using these tools and are displayed under academic fair use principles and in accordance with the tools’ terms of use.
Fig. 4
Fig. 4
Identification of consensus drug candidates across three computational screening platforms. Venn diagram illustrating the overlap among drug candidates identified by three independent computational screening approaches: L1000FWD (200 drugs), L1000CDS2 (35 drugs), and SigCom LINCS (76 drugs). The analysis revealed five compounds common to all three platforms, representing the highest confidence therapeutic candidates for further evaluation. The diagram shows the complete distribution of drug candidates across platform intersections, highlighting the complementary nature of these screening approaches.
Fig. 5
Fig. 5
Morphological evaluation of drug candidate effects on TGF-β2–induced cell death in FECD model cells. Phase-contrast microscopy analysis of iFECD cells following drug treatment. Cells were pretreated with LDN193189 (1 µM), cercosporin (100 nM), or menadione (1 µM) for 24 h, followed by co-treatment with TGF-β2 (10 ng/mL) for 24 h. TGF-β2 treatment alone induced significant cell death, as evidenced by increased numbers of floating cells. Cotreatment with either LDN193189 or cercosporin markedly reduced TGF-β2-induced cell death, while menadione exacerbated cell death and induced widespread cell detachment, indicating cytotoxicity. Note that while LDN193189 and menadione were tested at 1 µM, cercosporin showed cytotoxicity at this concentration; therefore, a lower concentration of 100 nM was used based on preliminary studies demonstrating higher efficacy with reduced toxicity at this dose. Representative images from three independent experiments are shown. Scale bar: 100 μm.
Fig. 6
Fig. 6
LDN193189 suppresses TGF-β2-induced ECM production and protein aggregation in FECD model cells. (A-D) Quantitative PCR analysis of ECM-related gene expression in iFECD cells pretreated with LDN193189 (1 µM, 24 h) followed by TGF-β2 stimulation (10 ng/mL). Expression levels of (A) FN1 , (B) LTBP2 , (C) MATN3 , and (D) BGN were significantly increased by TGF-β2 and suppressed by LDN193189 treatment. Data represent mean ± SD ( n = 5). Statistical significance was determined using Dunnett’s multiple comparison test ( P < 0.05). (E) Immunofluorescence analysis of fibronectin expression. Cells were treated as described above and stained for fibronectin (green) and nuclei (DAPI, blue). LDN193189 treatment normalized the TGF-β2–induced increase in fibronectin expression. Scale bar: 50 μm. (F) Western blot analysis confirming the suppressive effect of LDN193189 on TGF-β2–induced fibronectin protein expression. (G) Aggresome staining demonstrating the effect of LDN193189 on protein aggregation. Red fluorescence indicates protein aggregates, and nuclei are counterstained with DAPI (blue). Scale bar: 50 μm. Representative images from three independent experiments are shown in panels E-G.
Fig. 7
Fig. 7
Cercosporin attenuates TGF-β2-induced ECM production and protein aggregation in FECD model cells (A-D) Quantitative PCR analysis of ECM-related gene expression in iFECD cells pretreated with cercosporin (100 nM, 24 h) followed by TGF-β2 stimulation (10 ng/mL). Cercosporin significantly suppressed TGF-β2-induced upregulation of (A) FN1 and (B) LTBP2 (P < 0.05). While (C) MATN 3 and (D) BGN expression showed downward trends in response to cercosporin treatment, these changes did not achieve statistical significance. Data represent mean ± SD (n = 5). Statistical significance was determined using Dunnett’s multiple comparison test. (E) Immunofluorescence analysis showing cercosporin-mediated suppression of TGF-β2–induced fibronectin expression (green). Nuclei were counterstained with DAPI (blue). Scale bar: 50 µm. (F) Western blot analysis confirming the inhibitory effect of cercosporin on TGF-β2–induced fibronectin protein expression. (G) Aggresome staining demonstrating the ability of cercosporin to reduce TGF-β2–induced protein aggregation (red). Nuclei are counterstained with DAPI (blue). Scale bar: 50 µm. Representative images from three independent experiments are shown in panels E-G.

Similar articles

References

    1. Eghrari, A. O., Riazuddin, S. A. & Gottsch, J. D. Fuchs corneal dystrophy. Prog Mol. Biol. Transl Sci.134, 79–97. 10.1016/bs.pmbts.2015.04.005 (2015). - PubMed
    1. Fautsch, M. P. et al. TCF4-mediated Fuchs endothelial corneal dystrophy: insights into a common trinucleotide repeat-associated disease. Prog Retin Eye Res.81, 100883. 10.1016/j.preteyeres.2020.100883 (2021). - PMC - PubMed
    1. Ong Tone, S. et al. Fuchs endothelial corneal dystrophy: the vicious cycle of Fuchs pathogenesis. Prog Retin Eye Res.80, 100863. 10.1016/j.preteyeres.2020.100863 (2021). - PMC - PubMed
    1. Okumura, N., Hayashi, R. & Koizumi, N. Perspective of future potent therapies for Fuchs endothelial corneal dystrophy. Open. Ophthalmol. J.12, 154–163. 10.2174/1874364101812010154 (2018). - PMC - PubMed
    1. Nikitina, A. S. et al. Dataset on transcriptome profiling of corneal endothelium from patients with Fuchs endothelial corneal dystrophy. Data Brief.25, 104047. 10.1016/j.dib.2019.104047 (2019). - PMC - PubMed

MeSH terms

Substances

LinkOut - more resources