. 2025 Apr 26;15(1):14622.
doi: 10.1038/s41598-025-98490-2.

Predictive models and WTAP targeting for idiopathic pulmonary fibrosis (IPF)

Affiliations

Predictive models and WTAP targeting for idiopathic pulmonary fibrosis (IPF)

Guo-Dong Li et al. Sci Rep. .

Abstract

Emerging evidence suggests that N6-methyladenosine (m6A) modification significantly influences lung injury, lung cancer, and immune responses. The current study explores the potential involvement of m6A modification in the development of IPF. This research analyzed the GSE93606 dataset of 20 non-IPF and 154 IPF patients, identifying 26 m6A regulators and developing predictive models with RF and SVM, assessed via ROC curves. A nomogram was created with selected m6A factors, including molecular subtyping, PCA for m6A features, immune cell analysis, DEG identification, and functional enrichment. In vitro experiments on MRC-5 cells used RT-qPCR and Western blotting, and virtual drug screening targeted the WTAP protein through molecular docking. Analysis revealed 26 differential m6A regulators in IPF patients, with 16 significant; IGFBP2 and YTHDF2 were overexpressed, while others decreased. RF and SVM models identified predictive m6A regulators, and a nomogram was developed using five factors to predict IPF incidence. Distinct m6A patterns showed changes in RNA levels of specific genes in the BLM-induced group, and five compounds targeting WTAP were identified. This research explored m6A factors' impact on IPF diagnosis and prognosis, identifying WTAP as a potential biomarker.

Keywords: Idiopathic pulmonary fibrosis; Immune cell infiltration; Molecular docking; Prognostic biomarker; WTAP.


Conflict of interest statement

Declarations. Competing interests: The authors declare no competing interests.

Figures

Fig. 1
Fig. 1
Landscape of N6-methyladenosine (m6A) regulators in IPF. (a) Heatmap illustrating the differential expression of 16 m6A regulators. (b) Histogram depicting the variance in expression levels of 26 m6A regulators between the healthy control group(con) and IPF patients(treat). (c) Utilize the “RCircos” package to visualize the chromosomal locations of 26 m6A regulators. *p < 0.05, ** p < 0.01, and ***p < 0.001.
Fig. 2
Fig. 2
The correlation between m6A regulators in IPF. (a–e) The correlation between FTO and other m6A regulators (ELAVL1, LRPPRC, RBMX, METTL3, and METTL16). (f–h) The correlation between WTAP and other m6A regulators (HNRNPC, HNRNPA2B1, and YTHDC1).
Fig. 3
Fig. 3
Construction of Random Forest (RF) and Support Vector Machine (SVM) models. (a) Residual boxplot of the RF and SVM models. (b) Reverse cumulative distribution plots of the RF and SVM models. (c) ROC curves for the RF and SVM models. (d) Evaluation of the importance of 16 m6A regulatory factors using the RF model. (e) Cross-validation curves of the RF model illustrating error levels for the treatment group (red line), control group (green line), and overall sample (black line).
Fig. 4
Fig. 4
The construction of nomogram model. (a) A Nomogram model built using 5 candidate m6A regulators. A cumulative score of 33 corresponds to a 10% prevalence rate, and a score of 70 represents a 90% prevalence rate. (b) Assessment of the nomogram model accuracy via calibration curves. (c) Decision curve analysis of the nomogram model. (d) Clinical impact curve of the nomogram model.
Fig. 5
Fig. 5
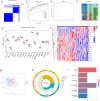
Consensus clustering of 16 m6A regulatory factors in IPF. (a) Consensus clustering matrix at k = 2. (b) Consensus clustering Cumulative Distribution Function (CDF) for k values from 2 to 9. (c) Relative change in the area under the CDF curve when k = 2. (d) Item tracking plot for Consensus clustering. (e) Histogram of Cluster A and Cluster B. (f) Heatmap of Cluster A and Cluster B. (g) Principal Component Analysis based on 16 significant m6A regulatory factors showing significant differences between Cluster A and Cluster B. (h) GO enrichment analysis of m6A-related Differentially Expressed Genes (DEGs). (i) KEGG analysis of m6A-related DEGs. *p < 0.05, ** p < 0.01, and *** p < 0.001.
Fig. 6
Fig. 6
Single-sample Gene Set Enrichment Analysis (GSEA) for immune infiltration. (a) The difference in immune cell infiltration between the m6Acluster A and m6Acluster B. (b) A heatmap revealing the relationship between immune cells and 16 important m6A regulatory factors. (c) The difference in immune cell infiltration between subgroups with high and low expression of WTAP. (d) The difference in immune cell infiltration between subgroups with high expression and low expression of FTO. *p < 0.05, **p < 0.01, ***p < 0.001.
Fig. 7
Fig. 7
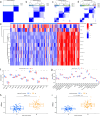
Consistent clustering analysis of m6A-related genes in IPF. (a–d) Consistency matrices for cluster numbers ranging from 2 to 5. (e) Expression heatmaps of m6A-related DEGs in geneCluster A and geneCluster B. (f) Differential expression histogram in geneClusterA and geneClusterB. (g) The difference in immune cell infiltration between geneCluster A and geneCluster B. (h) The difference in m6A scores between geneCluster A and geneCluster B. (i) The difference in m6A scores between m6Acluster A and m6Acluster B. *p < 0.05, **p < 0.01, and ***p < 0.001.
Fig. 8
Fig. 8
The role of m6A patterns and gene patterns in distinguishing IPF. (a) A Sankey diagram revealing the correlation between m6A patterns, m6A gene patterns, and m6A scores. (b) Different expression levels of cytokines between m6Acluster A and m6Acluster B. (c) Different expression levels of cytokines between geneCluster A and geneCluster B. (d) Different expression levels of epithelial markers and mesenchymal markers between m6Acluster A and m6Acluster B. (e) Different expression levels of epithelial markers and mesenchymal markers between geneCluster A and geneCluster B. (f) Differences in the expression levels of key genes for treating pulmonary fibrosis with Yùpíngfēng in m6Acluster A and m6Acluster B. (g) Differences in the expression levels of key genes for treating pulmonary fibrosis with Yùpíngfēng between geneCluster A and geneCluster B. *p < 0.05, **p < 0.01, and ***p < 0.001.
Fig. 9
Fig. 9
Expression of key genes in IPF model. (a–e) The mRNA expression of WTAP, FTO, HNRNPA2B1, ZC3H13, and α-SMA. (f) The protein expression of WTAP and α-SMA. *p < 0.05, **p < 0.01, and ***p < 0.001.
Fig. 10
Fig. 10
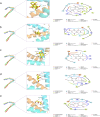
Virtual screening for potential drugs targeting WTAP. (a–e) Represent the top five drugs located, respectively: GA17, Chebulic acid, 4,8-Dimethoxy-7-hydroxy-2-oxo-2H-1-benzopyran-5,6-dicarboxylic acid, 7-Hydroxy eucommic acid, Saccharic acid.

References

    1. Guo, S. et al. Integrative analysis reveals the recurrent genetic etiologies in idiopathic pulmonary fibrosis. QJM: Monthly J. Assoc. Phys.116, 983–992. 10.1093/qjmed/hcad206 (2023). - PubMed
    1. Phan, T. H. G. et al. Emerging cellular and molecular determinants of idiopathic pulmonary fibrosis. Cell. Mol. Life Sci.: CMLS78, 2031–2057. 10.1007/s00018-020-03693-7 (2021). - PMC - PubMed
    1. Mei, Q., Liu, Z., Zuo, H., Yang, Z. & Qu, J. Idiopathic pulmonary fibrosis: An update on pathogenesis. Front. Pharmacol.12, 797292. 10.3389/fphar.2021.797292 (2021). - PMC - PubMed
    1. Canestaro, W. J., Forrester, S. H., Raghu, G., Ho, L. & Devine, B. E. Drug treatment of idiopathic pulmonary fibrosis: Systematic review and network meta-analysis. Chest149, 756–766. 10.1016/j.chest.2015.11.013 (2016). - PubMed
    1. Huang, G., Huang, S. & Cui, H. Effect of M6A regulators on diagnosis, subtype classification, prognosis and novel therapeutic target development of idiopathic pulmonary fibrosis. Front. Pharmacol.13, 993567. 10.3389/fphar.2022.993567 (2022). - PMC - PubMed

MeSH terms

LinkOut - more resources