

Genomic, socio-environmental, and sequencing capability patterns in the surveillance of SARS-CoV-2 in Latin America and the Caribbean up to 2023
- PMID: 40287493
- PMCID: PMC12033298
- DOI: 10.1038/s41598-025-98829-9
Genomic, socio-environmental, and sequencing capability patterns in the surveillance of SARS-CoV-2 in Latin America and the Caribbean up to 2023
Abstract
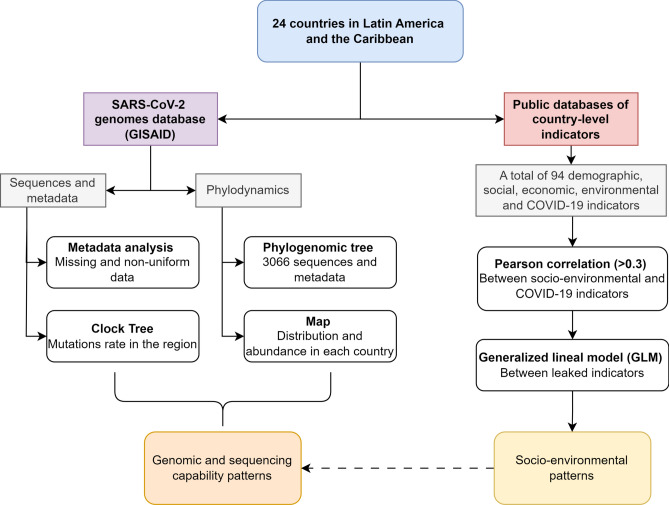
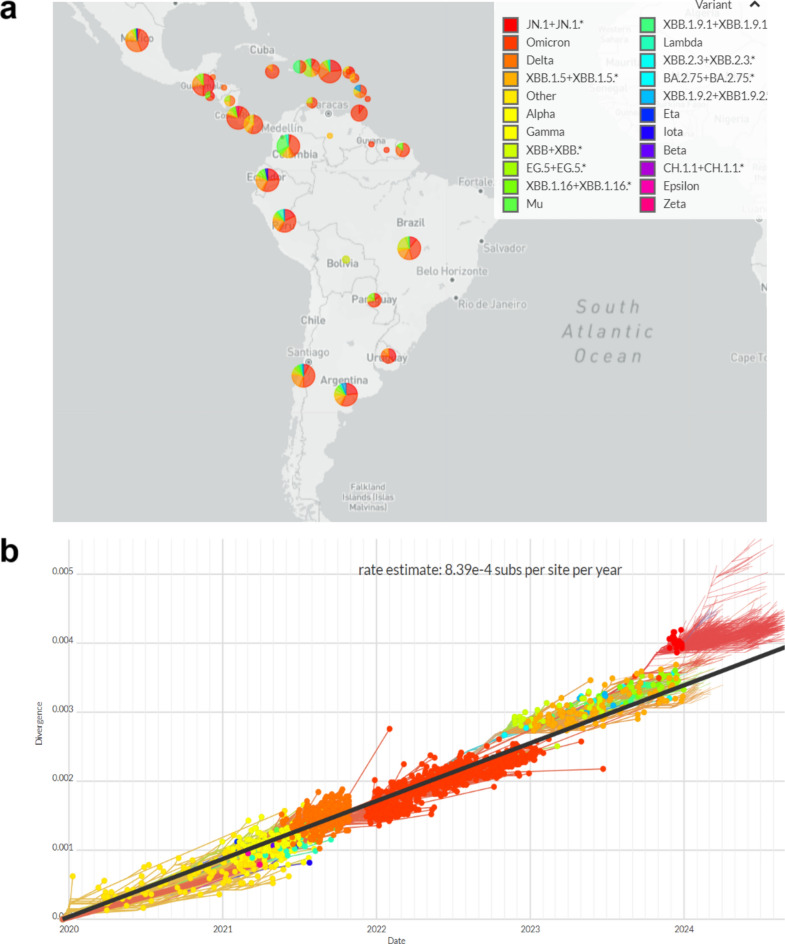
Latin America and the Caribbean (LAC) have been one of the most strongly impacted regions by the Coronavirus disease 2019 (COVID-19) emergency, with more than 83 million reported infections and 1.7 million deaths until December 2023, intensifying economic and social inequalities. This study aimed to provide information to the regional SARS-CoV-2 surveillance programs by determining genomic, socio-environmental, and sequencing capacity patterns associated with the circulation of the virus in Latin America up to 2023. Data from 24 countries in LAC were analyzed using public databases up to December 2023. A sampling of SARS-CoV-2 sequences from cases in the region enabled a phylogenomic study to elucidate the temporal distribution of various variants of concern (VOCs), mutations, and recombinants. Also, we identified differences in sequencing capabilities in LAC. Additionally, correlation and generalized linear model (GLM) analyses were conducted to explore potential associations between 89 socio-environmental variables and five COVID-19 indicators at the country level. The phylogenomic analyses revealed a diversity of variants with the predominance of some during specific periods, mainly VOCs and some recombinant cases, and a mutation rate of 8.39 × 10⁻⁴ substitutions per site per year, which are in line with other regions of the world. Besides, a low sequencing rate in LAC (on average 0.7% of cases) and incomplete databases in several countries were identified. In the analysis of indicators, correlations between 9 socio-environmental indicators and four COVID-19 variables associated with cases, deaths, and diagnostic tests related to the virus in the region, although not for sequencing percentages. This study provides information about the development of COVID-19 disease in LAC in terms of the viral genome, sequencing capabilities, and the region's complex socio-environmental conditions. Therefore, emphasis must be placed on implementing an integrated epidemiological surveillance approach to strengthen public health infrastructure and improve cooperation and preparedness for future infections affecting this region.
Keywords: 2 genome; 2023; COVID-19; CoV; Latin America and the Caribbean; SARS; Sequencing capability; Socio-environmental indicators.
© 2025. The Author(s).
Conflict of interest statement
Declarations. Competing interests: The authors declare no competing interests.
Figures


Similar articles
-
Implementation of a COVID-19 Genomic Surveillance Regional Network for Latin America and Caribbean region.PLoS One. 2022 Mar 3;17(3):e0252526. doi: 10.1371/journal.pone.0252526. eCollection 2022. PLoS One. 2022. PMID: 35239677 Free PMC article.
-
Dispersion patterns of SARS-CoV-2 variants Gamma, Lambda and Mu in Latin America and the Caribbean.Nat Commun. 2024 Feb 28;15(1):1837. doi: 10.1038/s41467-024-46143-9. Nat Commun. 2024. PMID: 38418815 Free PMC article.
-
Updated Surveillance Metrics and History of the COVID-19 Pandemic (2020-2023) in Latin America and the Caribbean: Longitudinal Trend Analysis.JMIR Public Health Surveill. 2024 May 17;10:e44398. doi: 10.2196/44398. JMIR Public Health Surveill. 2024. PMID: 38568194 Free PMC article.
-
COVID-19 in Latin America and the Caribbean: Two years of the pandemic.J Intern Med. 2022 Sep;292(3):409-427. doi: 10.1111/joim.13499. Epub 2022 Apr 22. J Intern Med. 2022. PMID: 35411985 Free PMC article. Review.
-
HIV and COVID-19 in Latin America and the Caribbean.Curr HIV/AIDS Rep. 2022 Feb;19(1):37-45. doi: 10.1007/s11904-021-00589-4. Epub 2022 Jan 29. Curr HIV/AIDS Rep. 2022. PMID: 35092570 Free PMC article. Review.
References
MeSH terms
Grants and funding
LinkOut - more resources
Full Text Sources
Medical
Miscellaneous
